Conceptual Framework Examples
Six real frameworks, six different shapes, and a template for yours


The 30-second summary
Seeing real conceptual frameworks is the quickest way to work out what yours should look like. Below are six from real dissertations, read arrow by arrow, because every arrow is a claim the study will test or explore.
- Direct effects are the simplest shape: several independent variables, each with its own arrow (and hypothesis) to one outcome.
- A chain puts a variable in the middle: A leads to B and B leads to C, so B carries part of A’s effect on C.
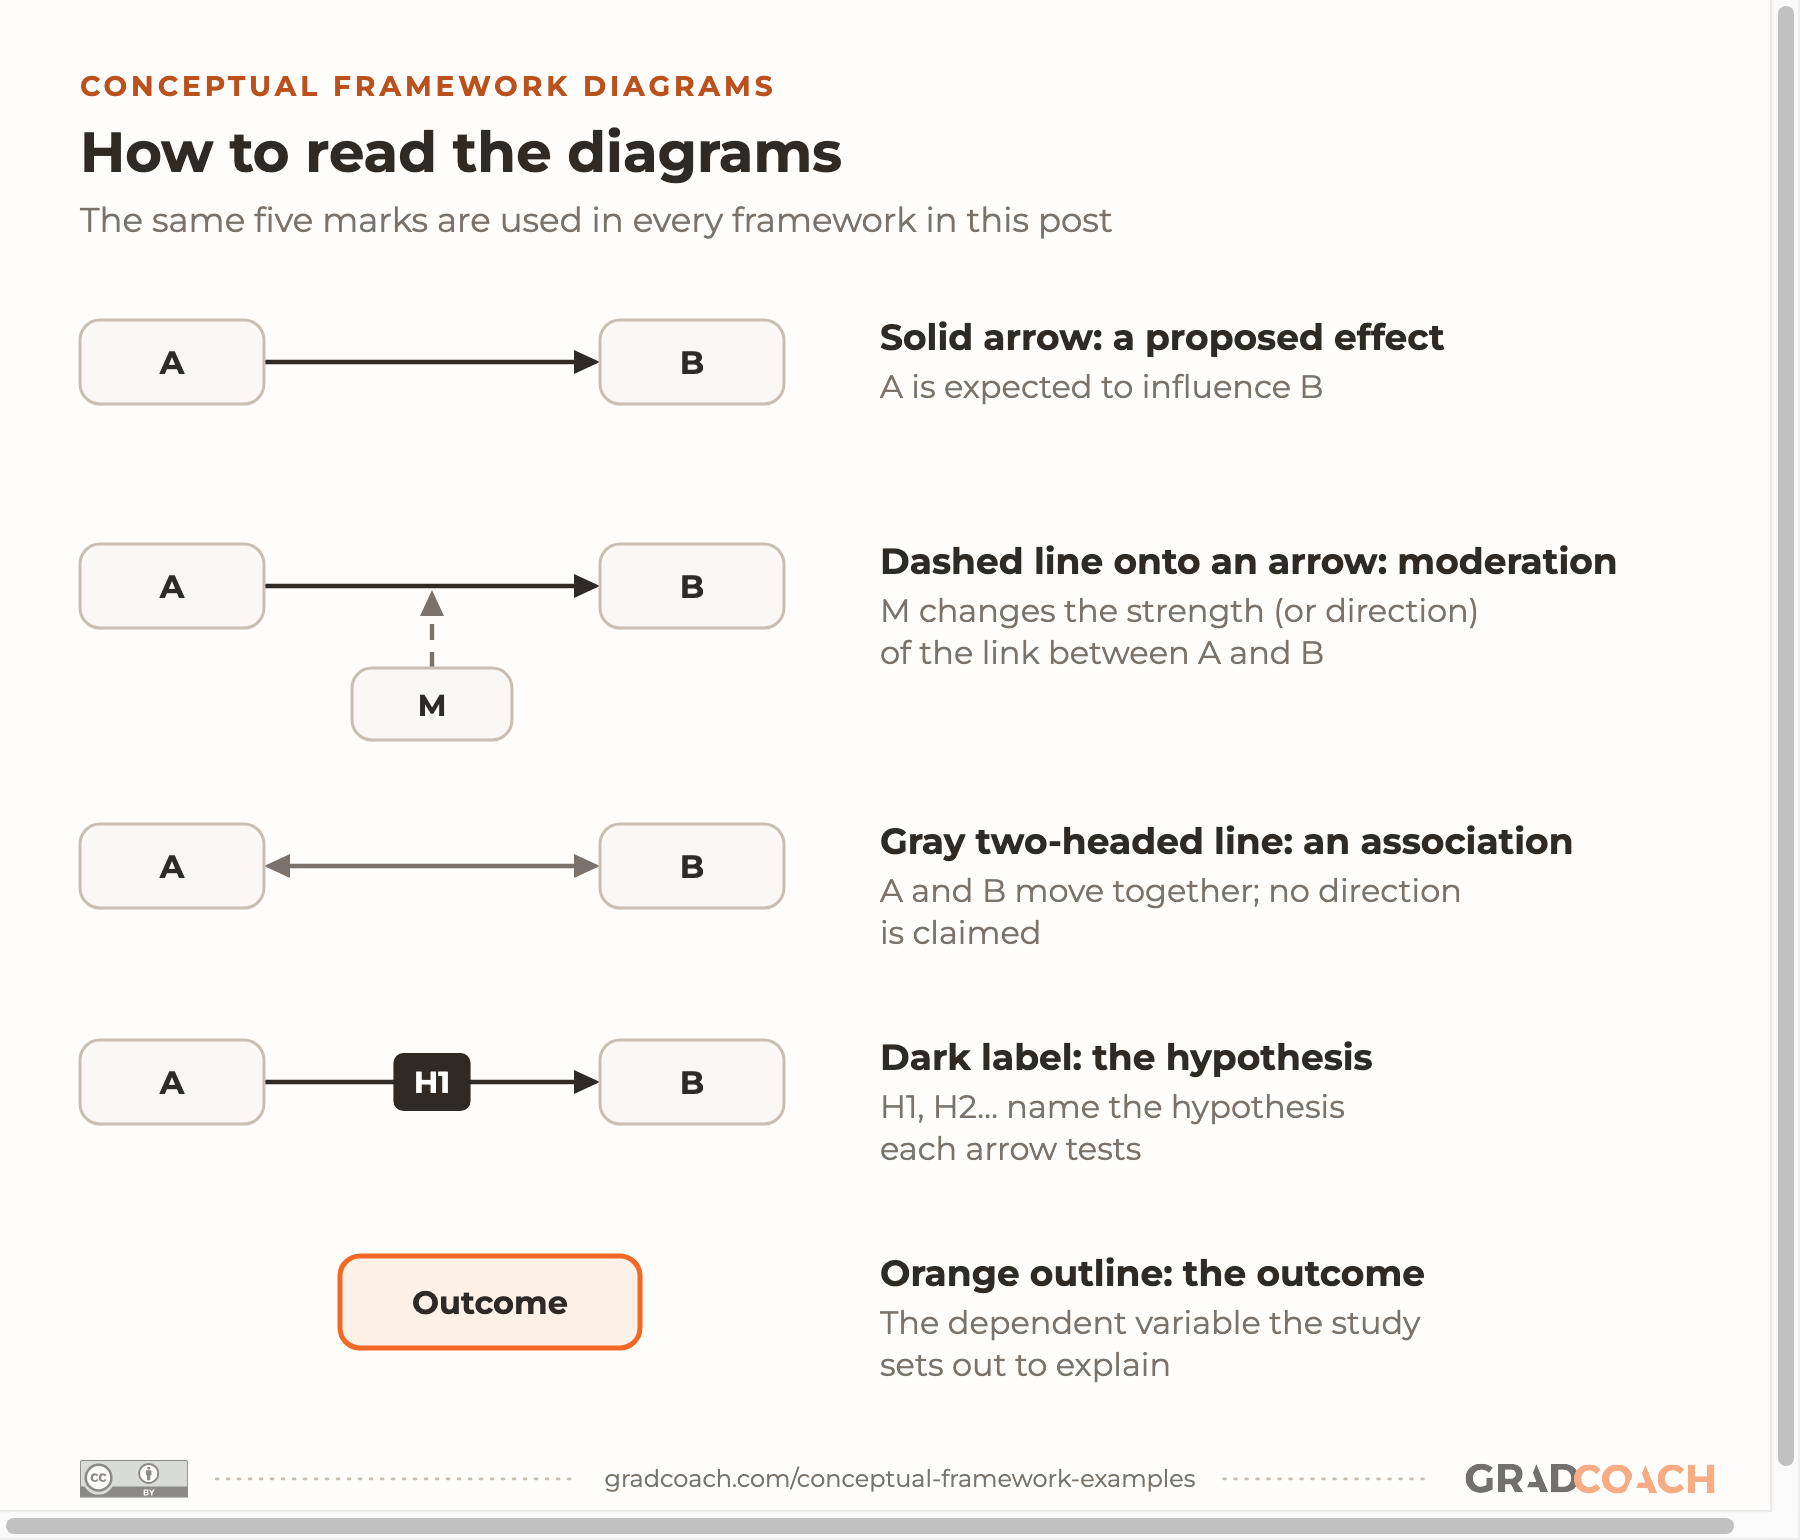
- A moderator changes the strength (or direction) of a relationship, so it’s often drawn as a line onto that arrow rather than onto a box.
- A qualitative framework maps the concepts and processes your study will explore, with no hypotheses attached to its arrows.
Ready to draw yours? Our free conceptual framework template provides a no-frills starting point to move you forward.
Navigate
Your conceptual framework is the one diagram that shows what your whole study claims. In a quantitative study, an arrow that can’t be traced to a theory, a hypothesis (or a research question) and a test is a promise your analysis can’t keep, and your committee will ask about it.
Across the 10,000+ students we’ve coached, we’ve found that most weak frameworks copy the look of a diagram rather than its logic. In this post, I’ll walk you through six real conceptual frameworks, each a different type, starting with the one from my own MBA dissertation. For each, you’ll see what the study asked, what every arrow claims, and what to take into your own. Then there’s a blank template to draw yours.
How to read these examples
A conceptual framework is your own map of the variables (or concepts) in your study and how you expect them to relate. If you’re unsure how that differs from a theoretical framework, I’ve covered the difference between a theoretical and a conceptual framework separately. The short version comes from a widely cited guide to dissertation frameworks:
Notice the phrase “within the theoretical framework”. Your diagram sits inside a theory, which is why each example below names the theory its framework rests on. When you read one, ask what each box is and what each arrow claims.
To make that easy, we’ve redrawn every framework in one style, using each thesis’s own variable names. The same key runs through all of them:

Example 1: Nine direct effects
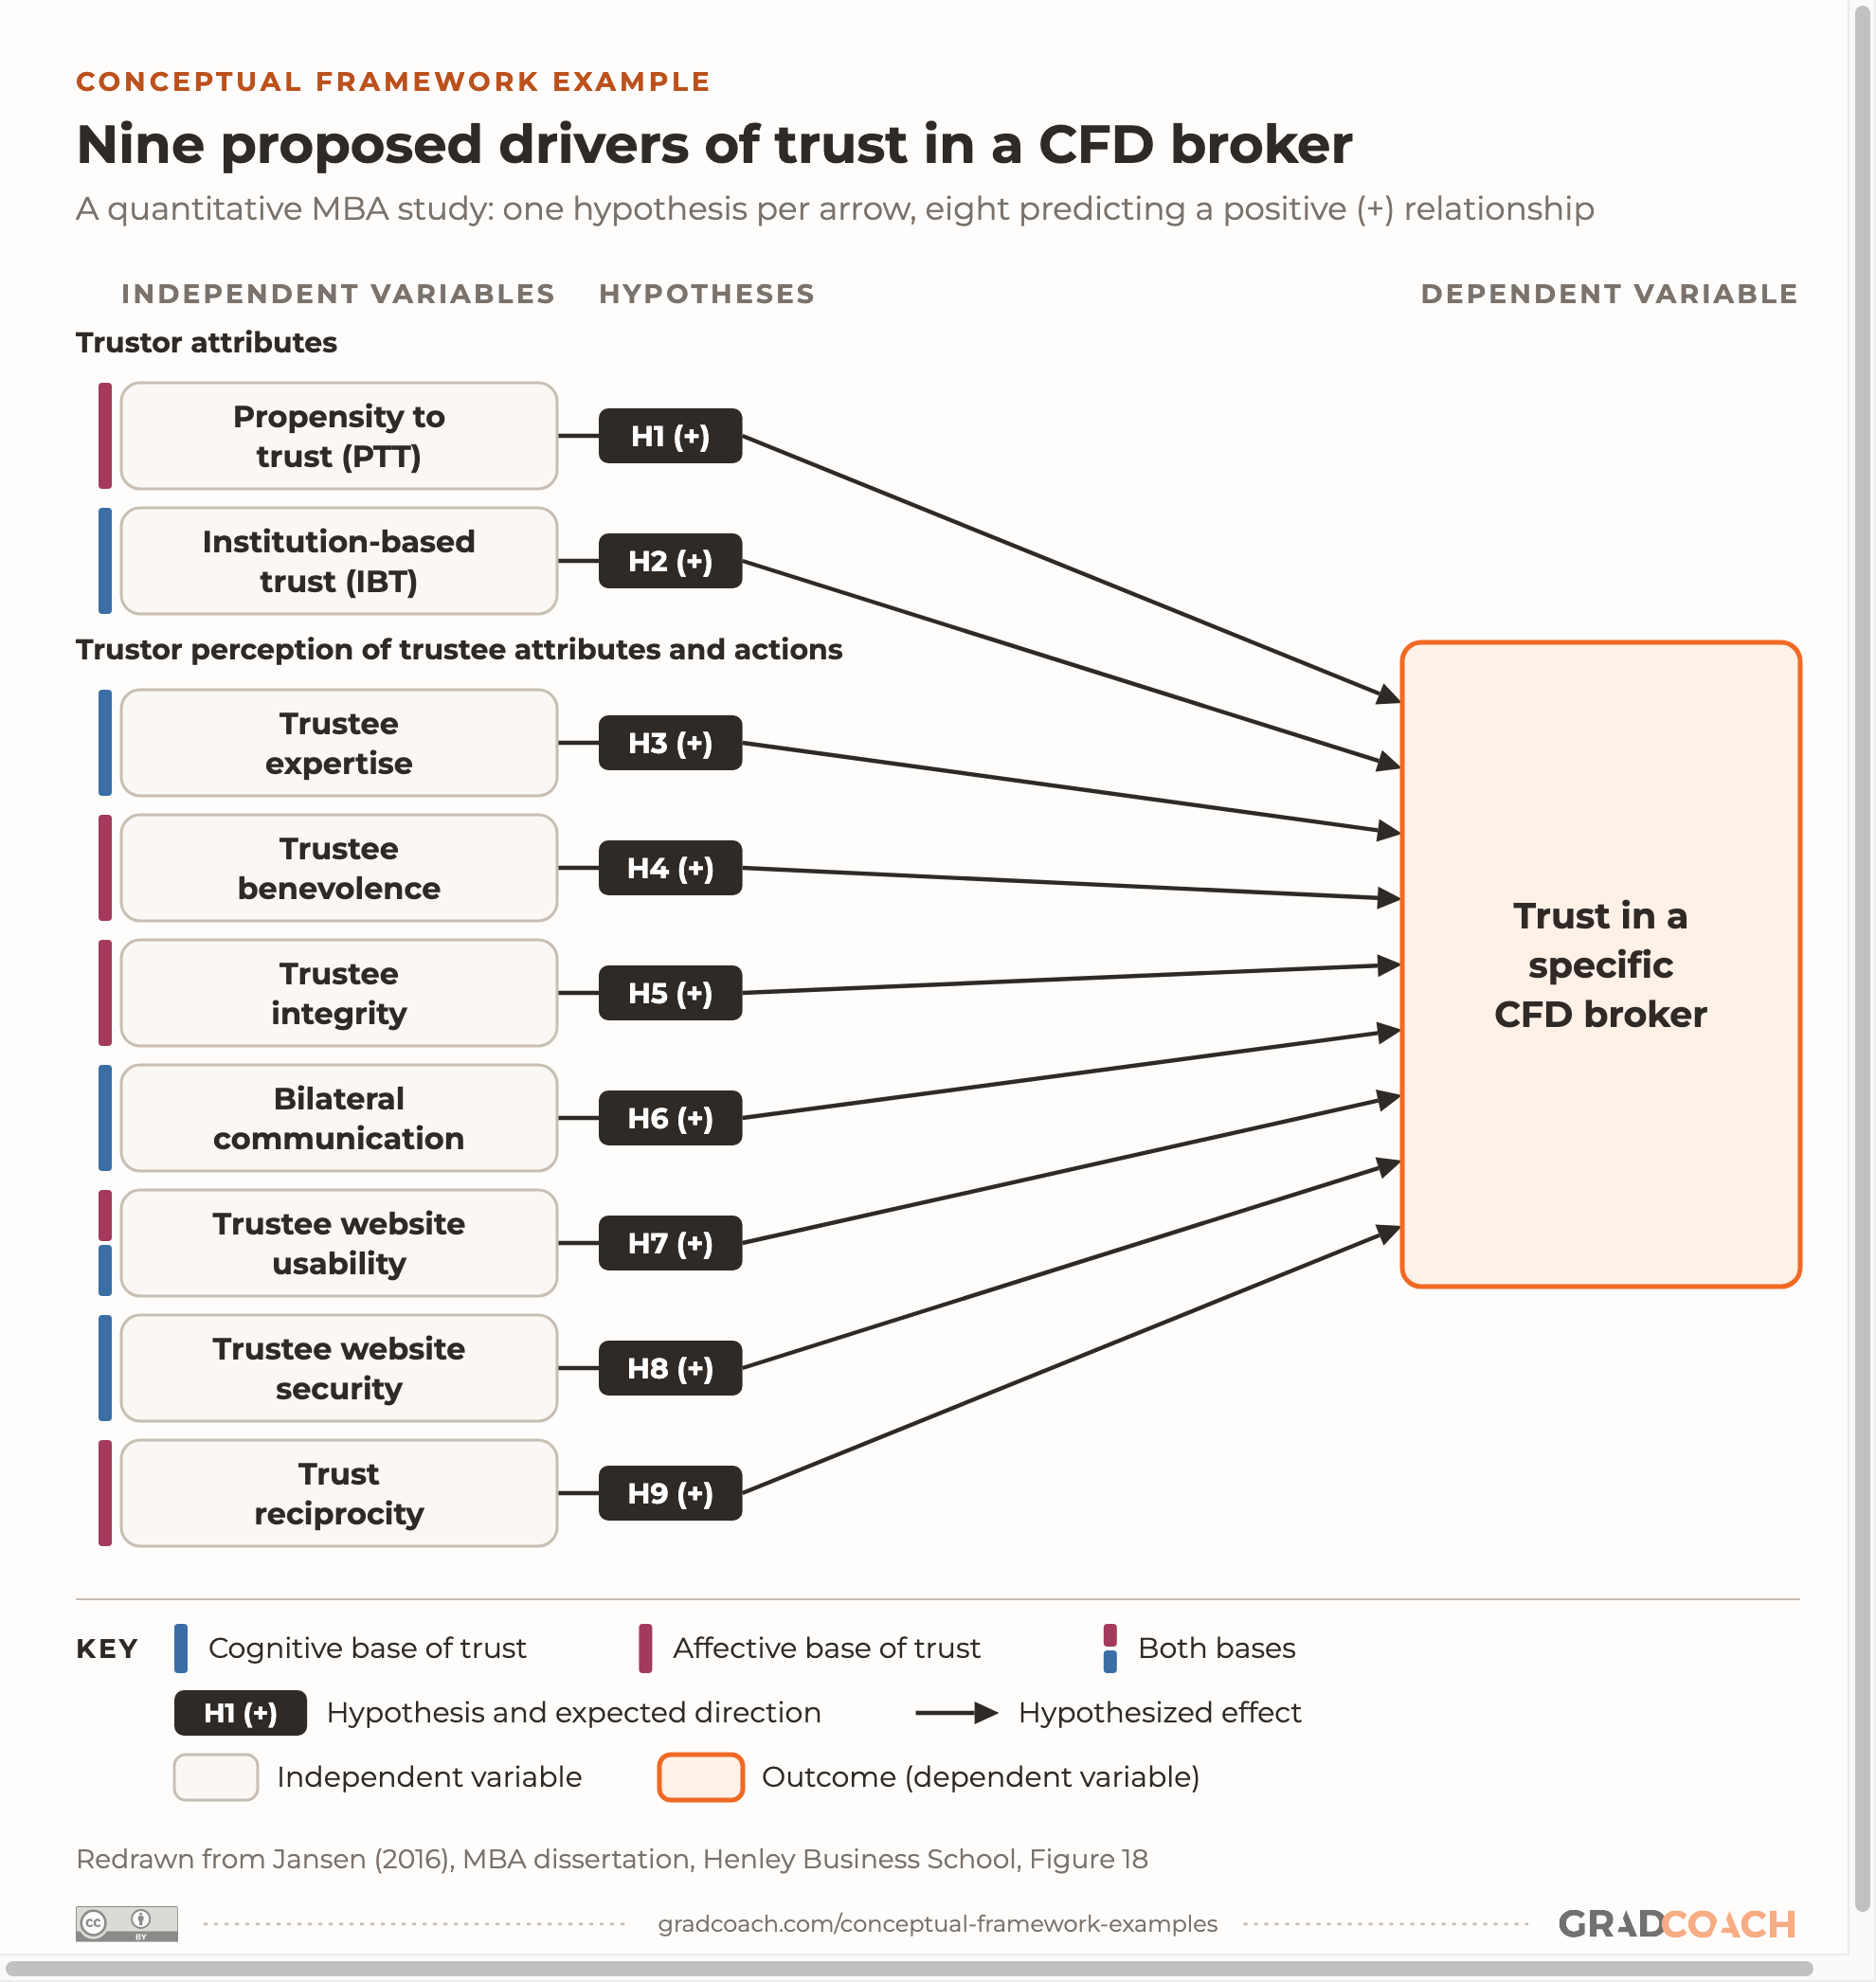
The simplest shape a conceptual framework takes is a set of direct effects: several independent variables, each with its own arrow to one outcome. This one is from my MBA dissertation, a quantitative study of which factors go with customers’ trust in their broker.
Here’s the research question that the framework was built to answer:
“Antecedents” just means the things that come before trust and might cause it. So the question is asking which factors drive trust, and the framework’s job was to name the candidates and say what I expected each one to do.
The variables and arrows. Nine independent variables sit on the left, in two groups: the customer’s own traits (their general propensity to trust, and their trust in the system of rules around them), and their perceptions of the broker. Each variable has one arrow to the outcome, trust in a specific CFD broker, and each arrow is one hypothesis. The study was correlational, so an arrow here claims that a factor moves with trust, not that it causes it.

Eight of the arrows were tested as correlations. The ninth, trust reciprocity, works differently: H9 predicted a difference in trust between customers who felt trusted by their broker and those who didn’t, so it was tested by comparing the two groups (i.e., a categorical variable).
The theory behind it. The variables came out of the literature review, which drew on Mayer, Davis and Schoorman’s integrative model of organizational trust alongside research on trust in e-commerce and in financial services. The review is where each of the nine hypotheses was argued for. That’s what makes an arrow defensible: a reason, from the literature, to expect it.
The same framework, after testing
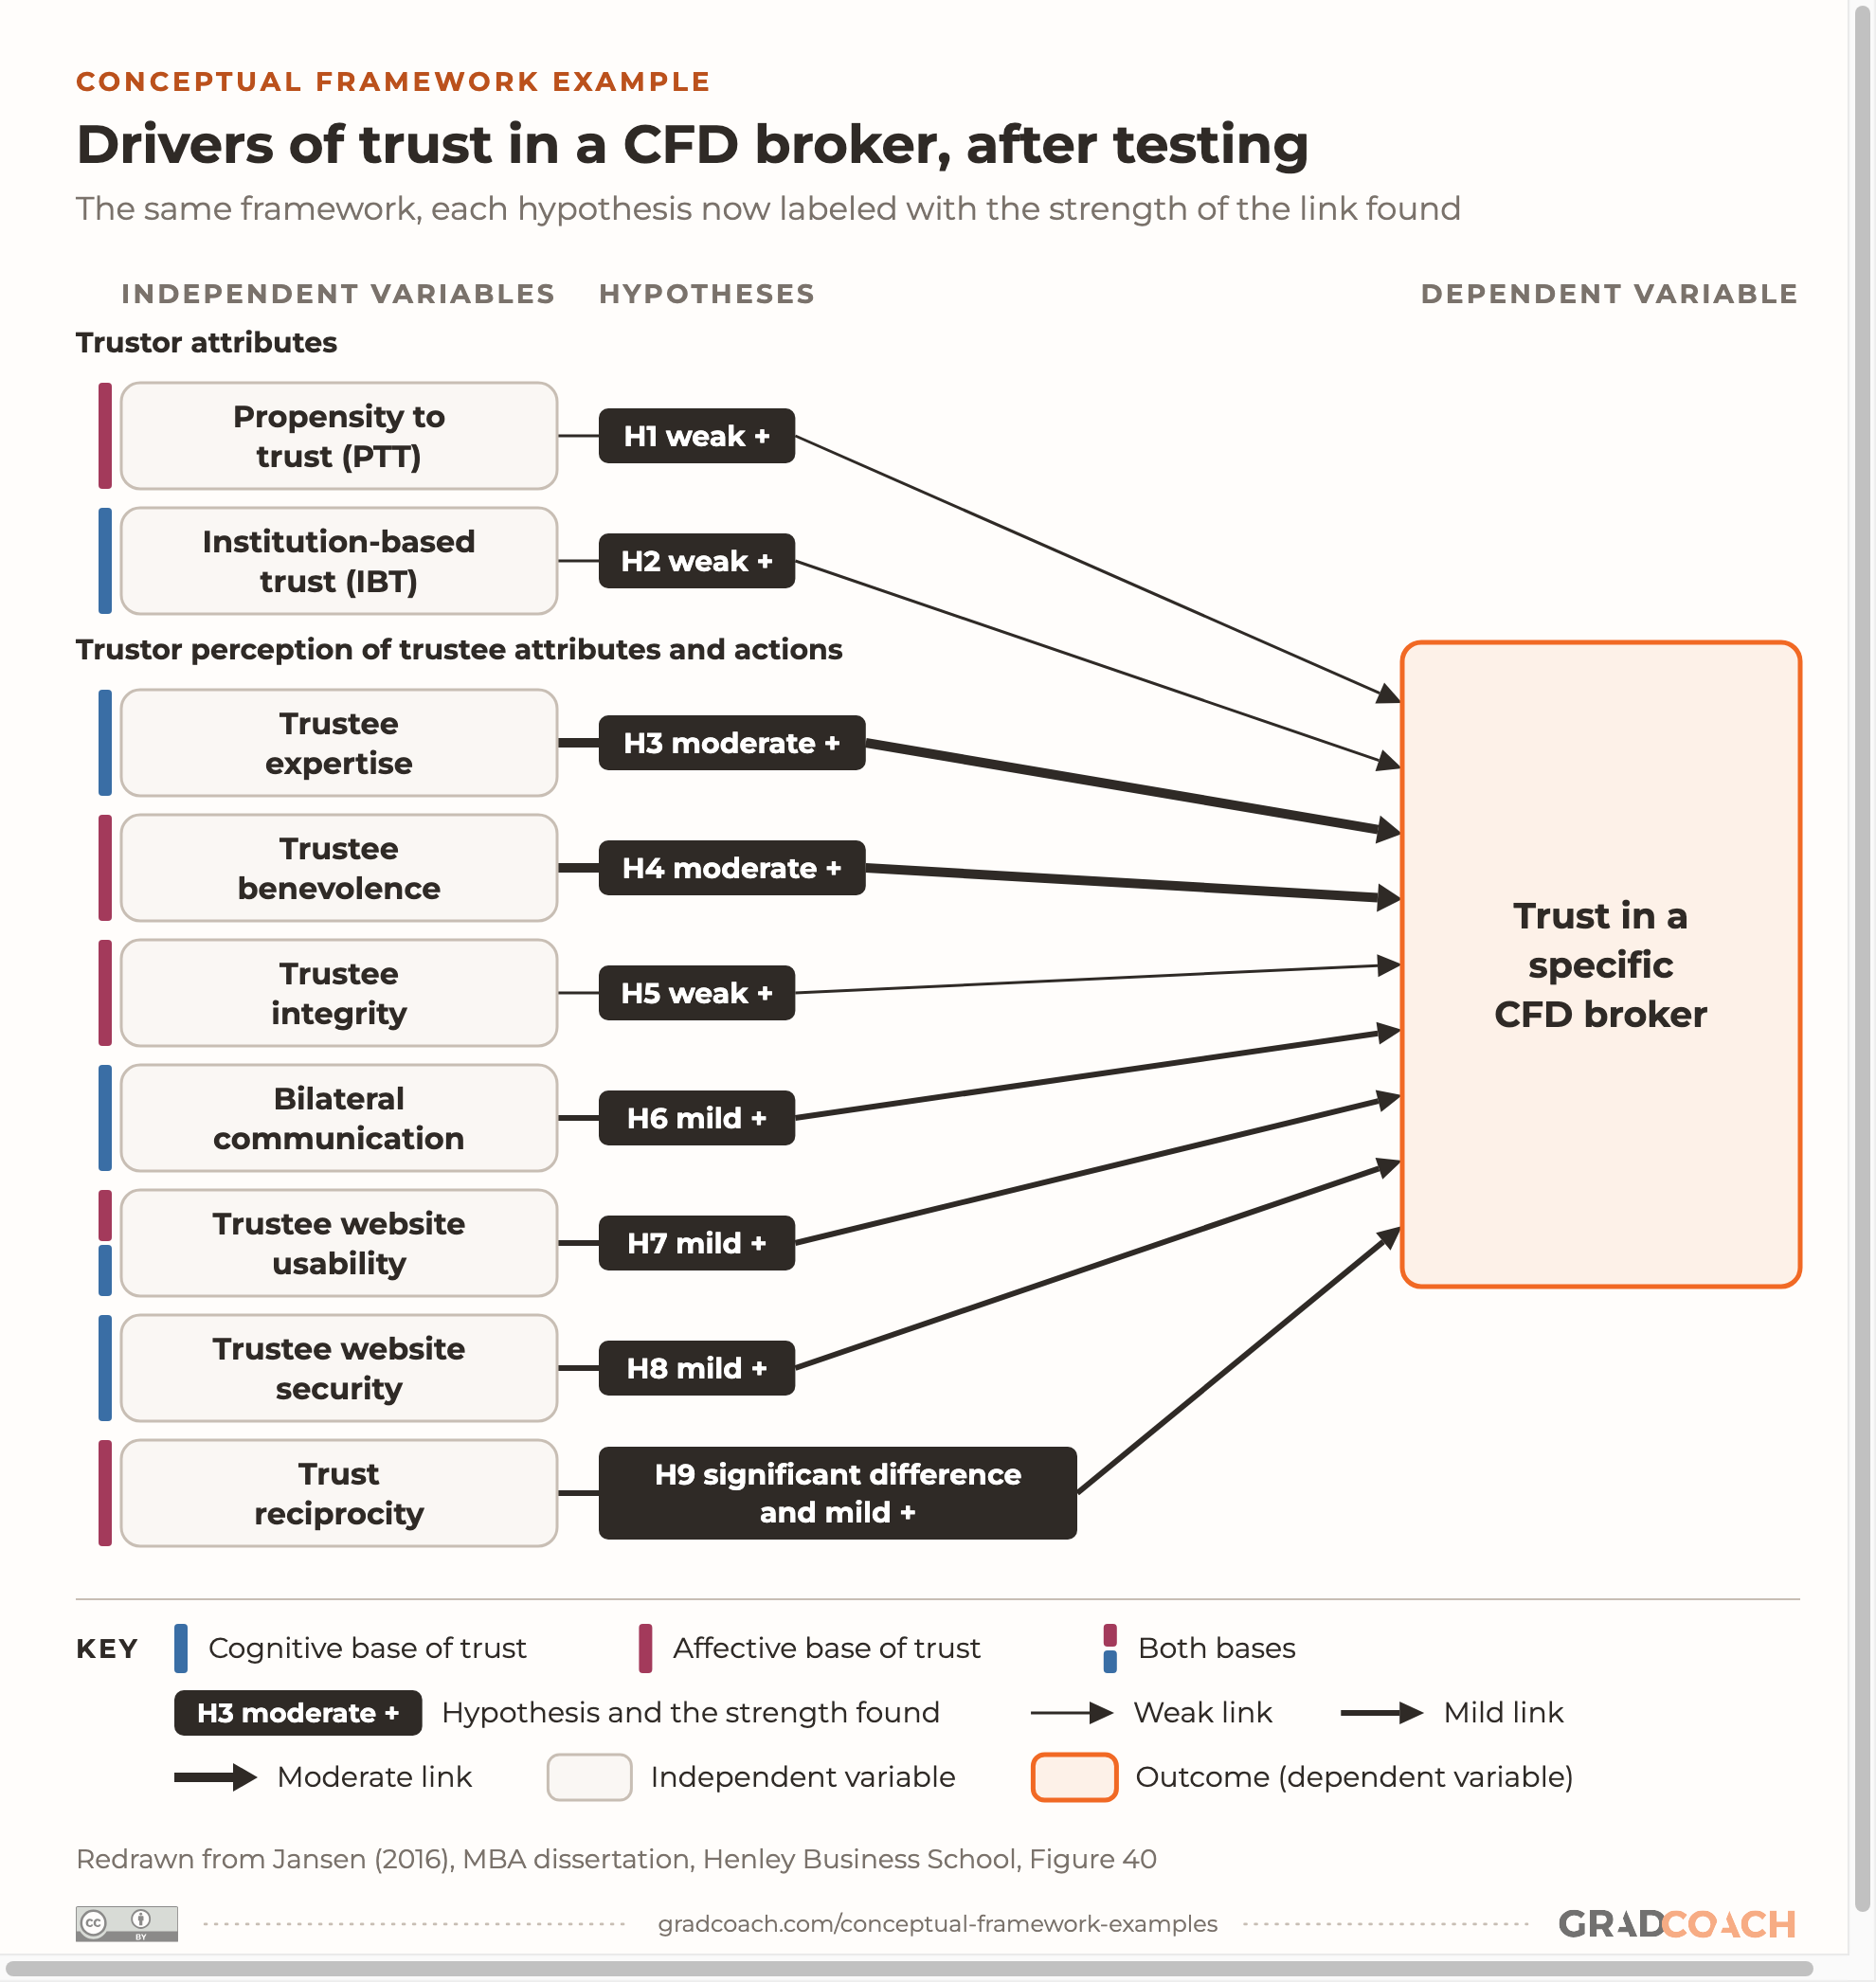
A conceptual framework doesn’t stop at the methodology chapter. After the analysis, I redrew it with what the data showed. The 345 survey responses weren’t normally distributed, so Pearson correlations were swapped for Spearman’s rank-order correlations, the planned regression analysis was dropped, and each link was graded by its strength (weak, mild or moderate).
Here’s the same diagram with the findings on it. Look at which arrows got thicker:

All nine hypotheses were supported, but the links weren’t equal. Customers’ views of the broker’s expertise and benevolence were most strongly related to trust, while integrity and the two customer traits came out weak.
The results also suggested a richer shape. The dissertation noted that communication, website usability and website security were more strongly related to expertise and benevolence than to trust itself, so it sketched a mediated version of the framework and left it, along with tests of moderation, to future research. That’s the honest end point for a framework: what you found, and what the next study should test.
One last thing about the label. The dissertation calls this diagram a “theoretical framework”. By the definitions above, it’s a conceptual framework: a map I built of variables and the relationships I expected, drawn from several sources rather than one borrowed theory. You’ll meet the same mismatch in your own reading (Huang’s, next, is an “operational framework”), so judge a framework by what it does, and use the label your program uses.
Example 2: A chain of effects
Not every arrow has to end at the outcome. In a chain, one variable leads to another, which leads to the next. This education PhD at Purdue studied undergraduates rating their first college math course, mostly in agriculture and STEM, and asked whether culturally responsive teaching (teaching that draws students’ cultures into how a course is taught) helps them feel they belong and feel capable.
Of its five research questions, the third is the one that the arrows answer:
The question asks about “relationships among” three things, not the effect of one on another. That wording suggests the study will map how they connect, and the framework is where it says how.
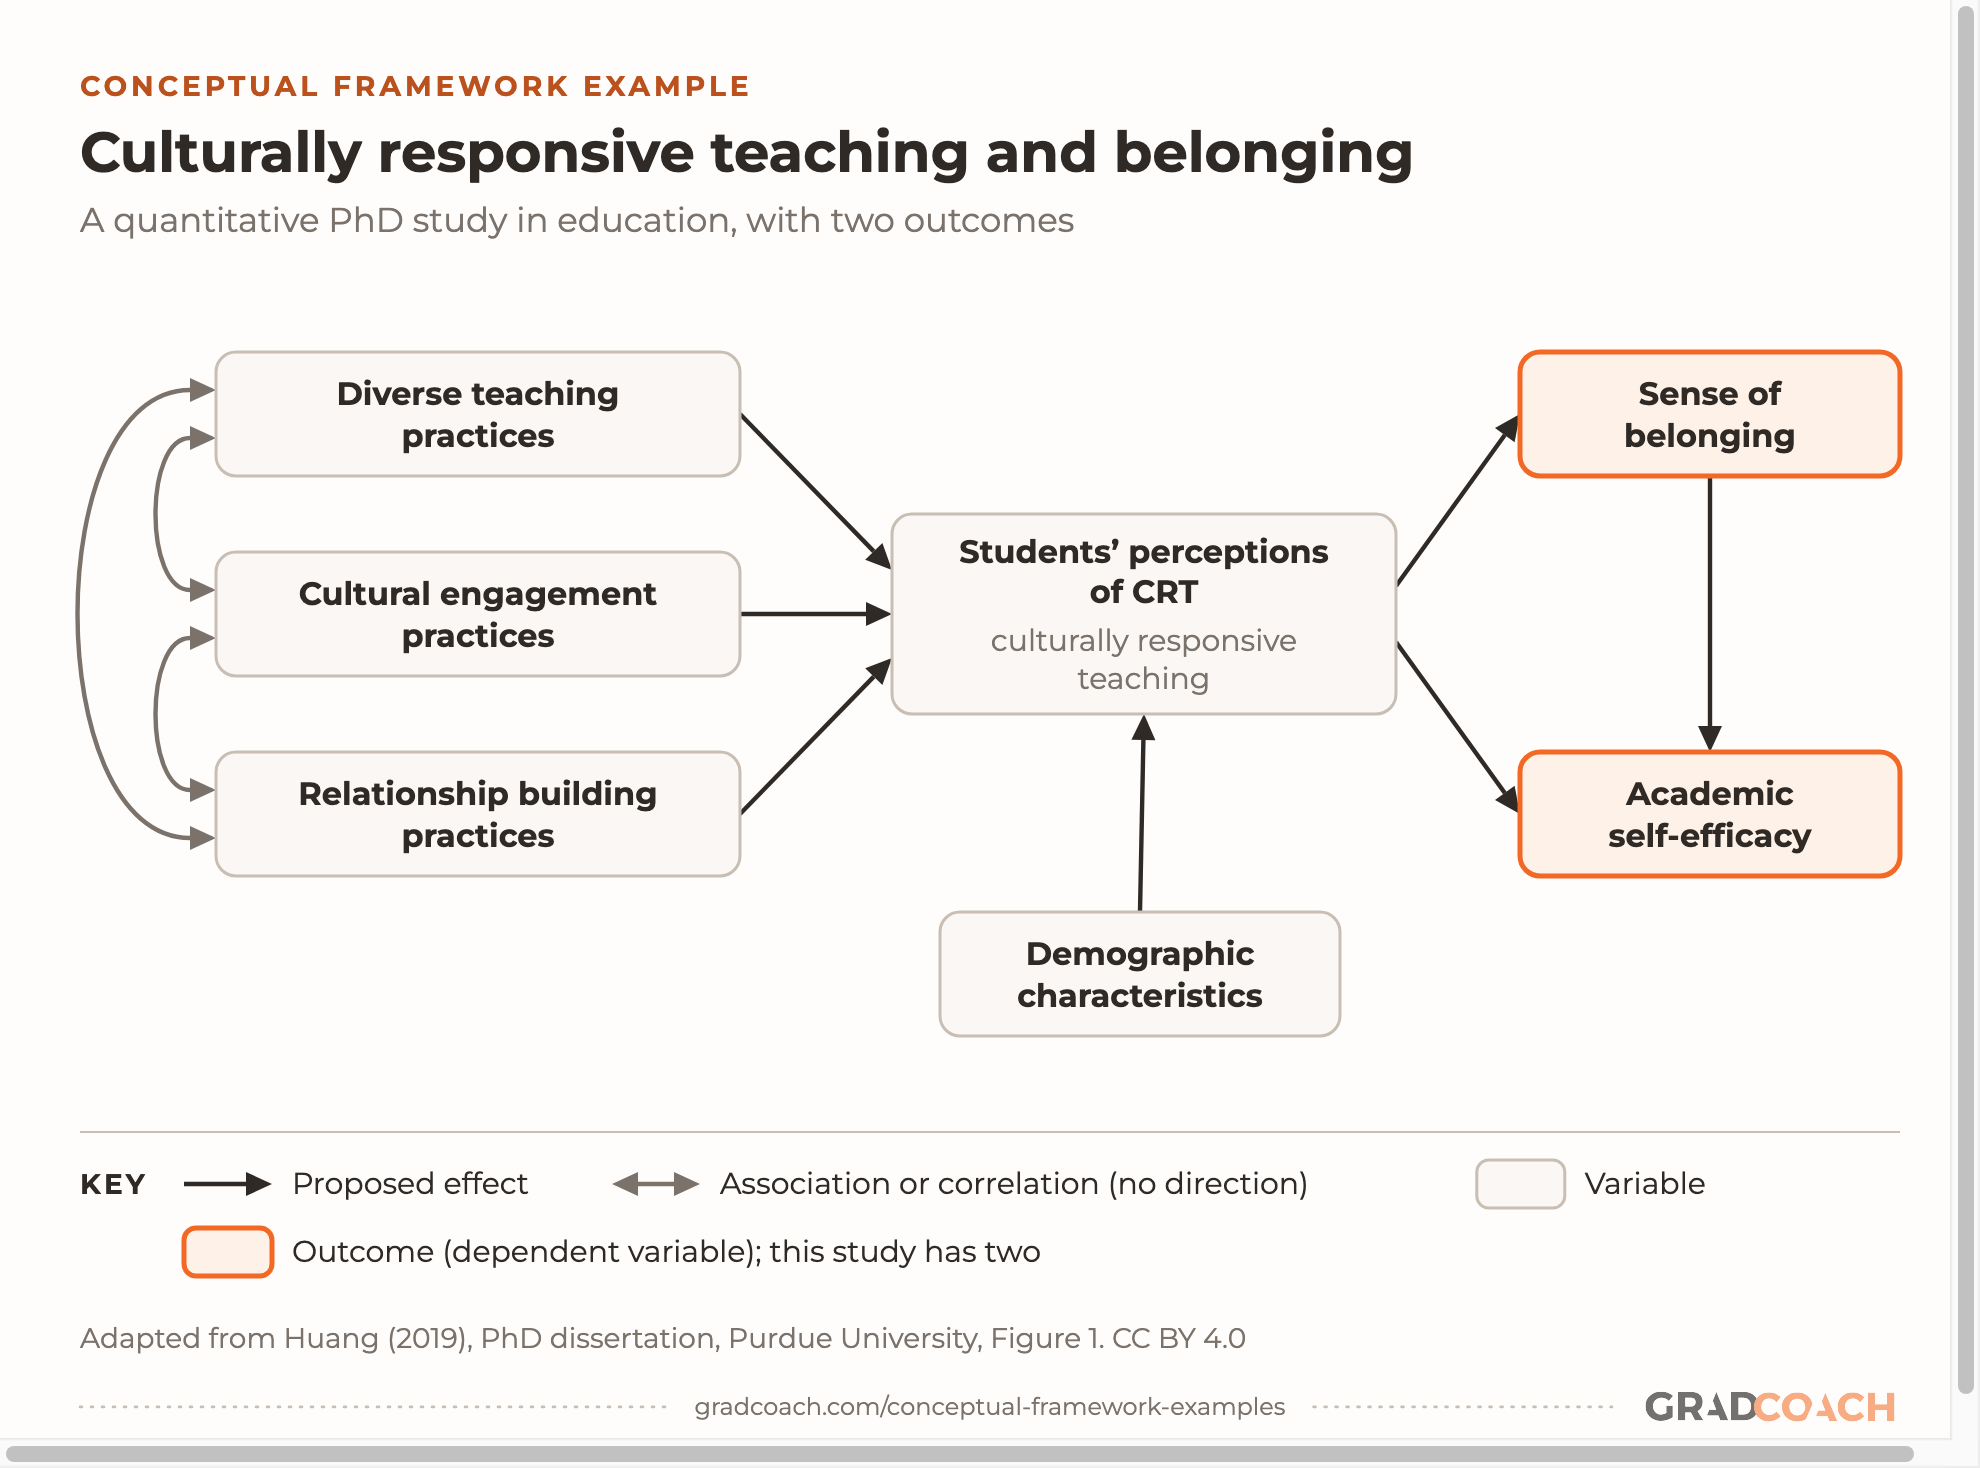
The variables and arrows. Students’ perceptions of culturally responsive teaching sit in the middle. The three teaching practices on the left are how those perceptions were measured: the thesis treats perceptions as a latent variable, one you can’t observe directly, so it’s captured through students’ ratings of three kinds of practice. Those three arrows are measurement rather than hypotheses: they show what the latent variable is built from. Huang calls the diagram an “operational framework” for that reason. Demographic characteristics feed in from below.
Follow the arrows to the right of the middle box and you’ll find the chain:

Perceptions lead to sense of belonging, and belonging leads to academic self-efficacy (students’ confidence in their ability to do the academic work). There’s also a direct arrow from perceptions to self-efficacy, so the diagram proposes two routes: straight there, and through belonging.
The theory behind it. Huang names Bandura’s social cognitive theory as the study’s theoretical framework, and builds this framework on two earlier studies of culturally responsive teaching. The theory says behavior comes from personal, behavioral and environmental factors interacting, which gives a reason to expect that what happens in a classroom (the environment) shapes how students see themselves (the personal). You can see how that theory is stated in our theoretical framework examples.
Example 3: A mediator and a moderator
This shape brings in two extra kinds of variable. A mediator sits on the path between cause and outcome and carries the effect, explaining how or why it happens. A moderator changes how strong that effect is, or even its direction. In the words of Baron and Kenny’s classic paper on the distinction, a moderator “affects the direction and/or strength of the relation” between two variables.
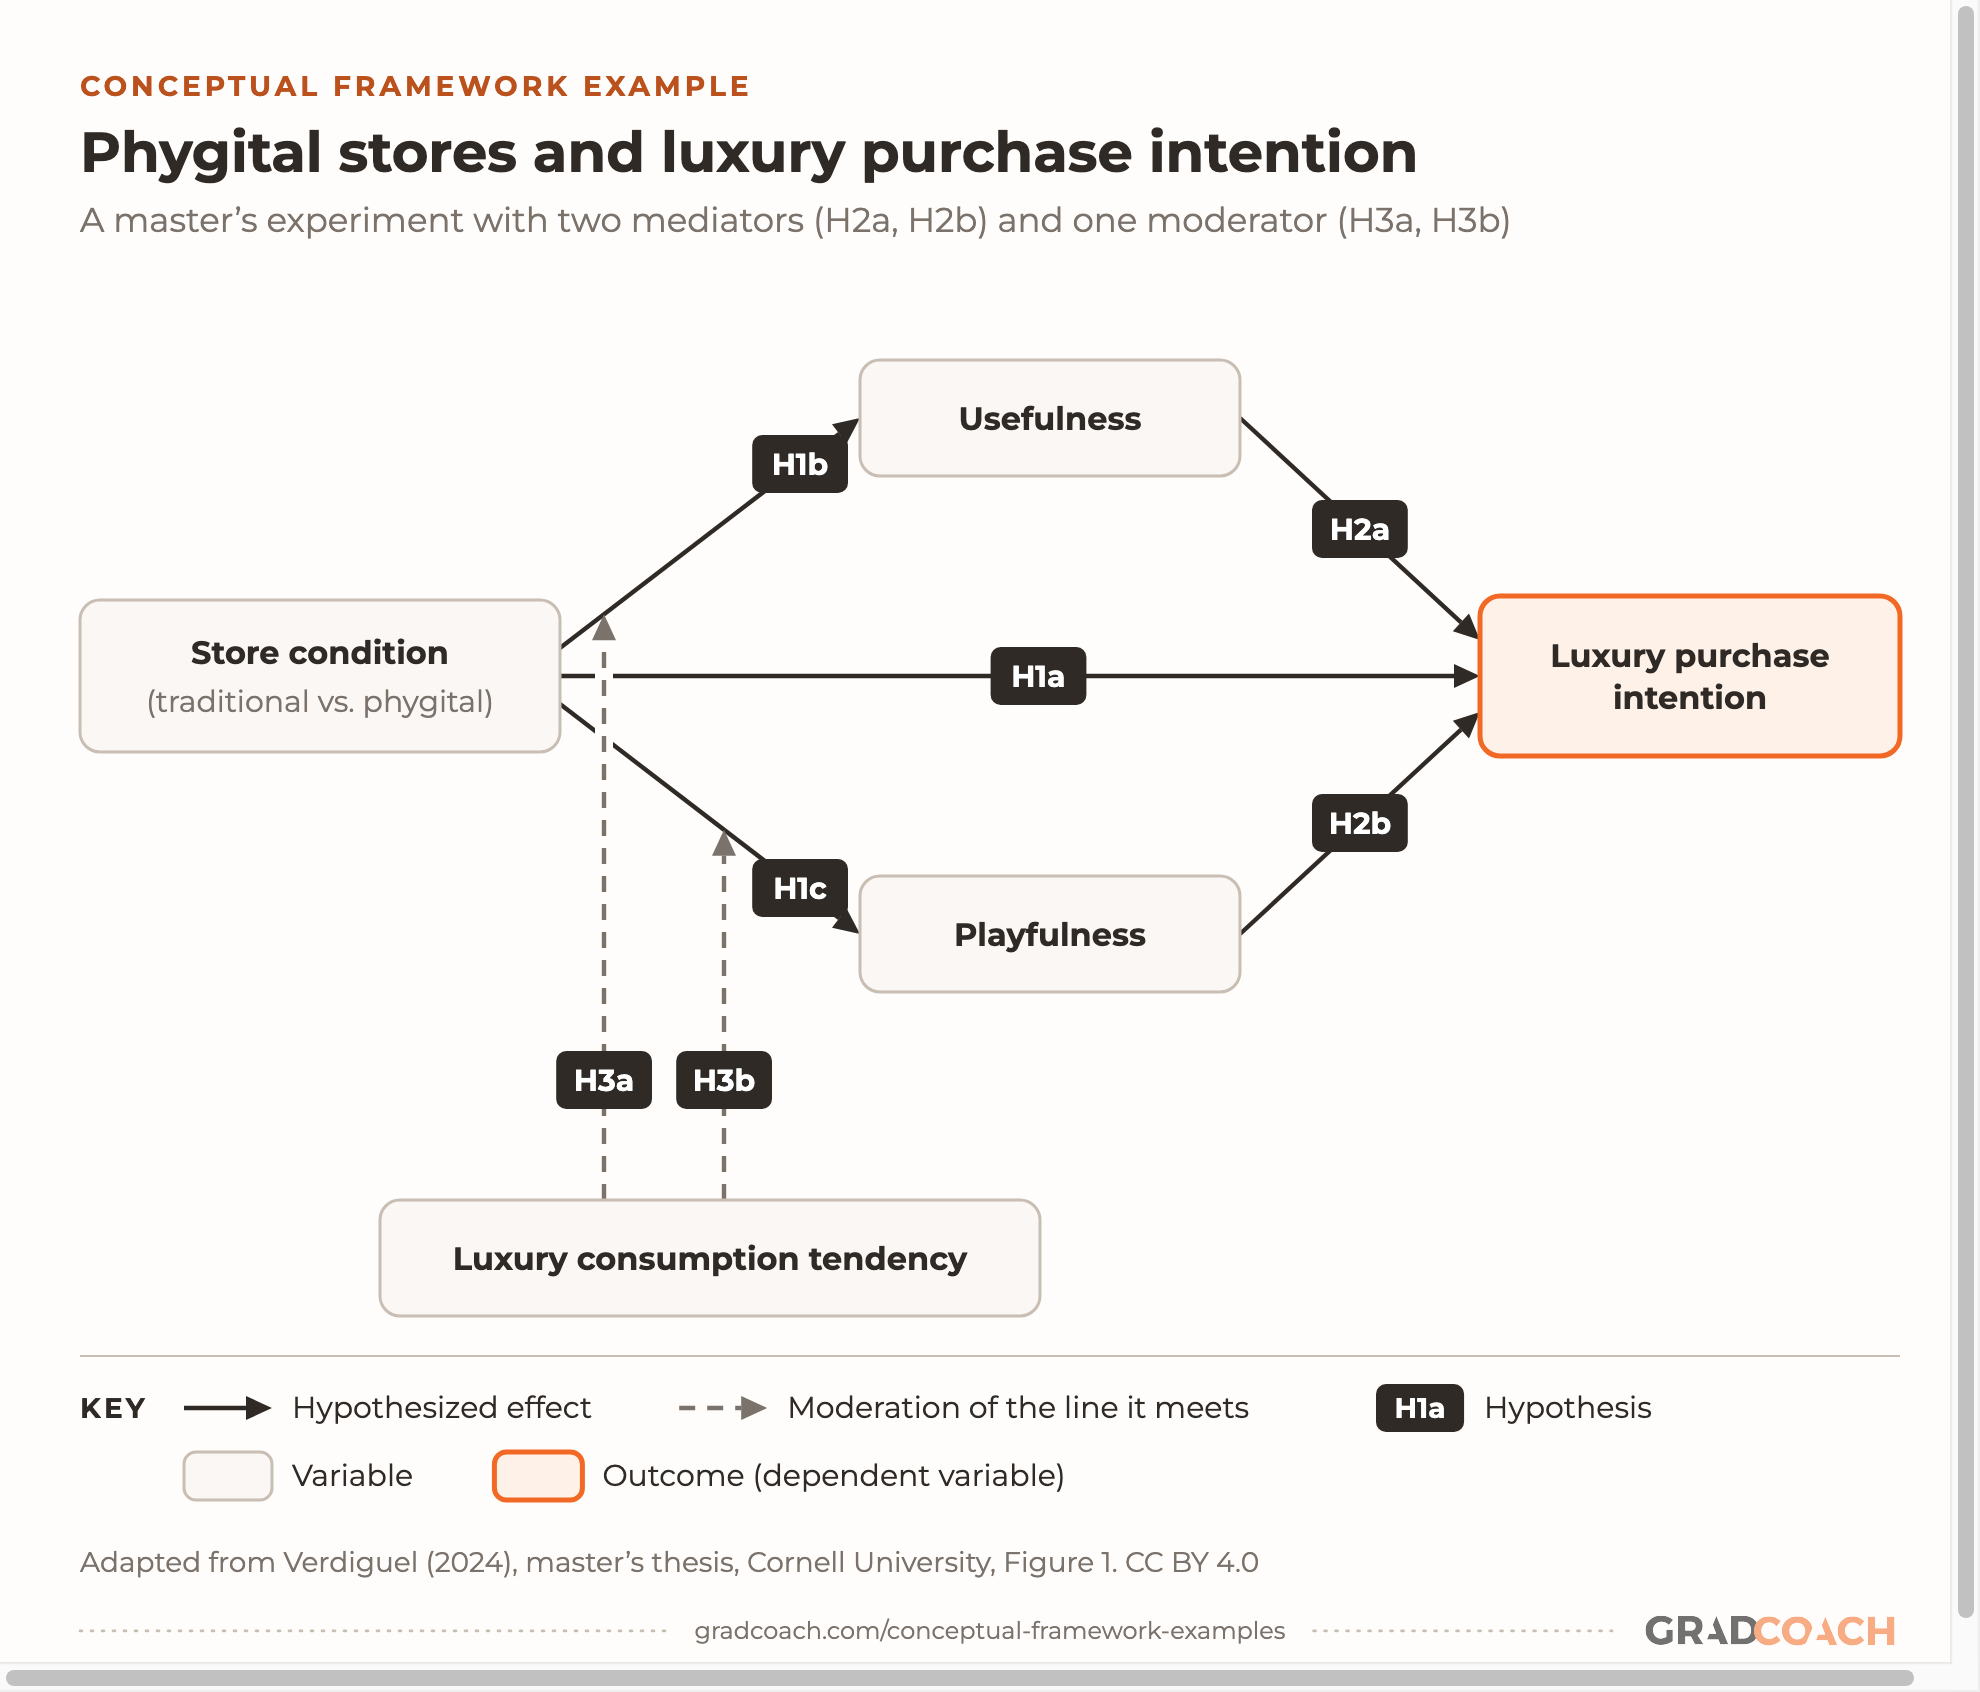
This master’s thesis in human-environment relations at Cornell, filed in our marketing collection, ran an experiment: 280 participants watched a video walkthrough of a virtual luxury store, either a traditional one or a “phygital” one that mixes physical and digital elements. It asked two research questions, and one word in each gives away the shape of the framework:
The word “through” in the first question is mediation, written as a question. The word “moderate” in the second needs no decoding. Between them, the two questions have already told you what the diagram will look like.
The variables and arrows. Store condition (traditional vs. phygital) is the independent variable, and luxury purchase intention is the outcome. Usefulness and playfulness are the two mediators. Luxury consumption tendency, a shopper’s general appetite for luxury, is the moderator. Here’s how the seven hypotheses map onto the arrows:

The thesis draws the moderator lines solid; we’ve dashed them to match the key. Either way, the line lands on an arrow, not on a box, because what it changes is a relationship. You’ll also see moderators pointed at a box; I’d still land the line on the arrow, because that’s where the claim is. Each hypothesis states one arrow in words. Here are three of them, one of each kind:
Notice how each one names its variables, its direction and its comparison. That’s what lets every hypothesis label on the diagram point to one testable sentence. If you want to see more ways of wording them, our research hypothesis examples take six real ones apart.
The theory behind it. The study rests on the Technology Acceptance Model, which explains how people form attitudes toward a technology, combined with research on two shopping motives: getting a task done (useful) and enjoying the experience (playful). The two mediators are those two motives, measured.
Example 4: A moderated association
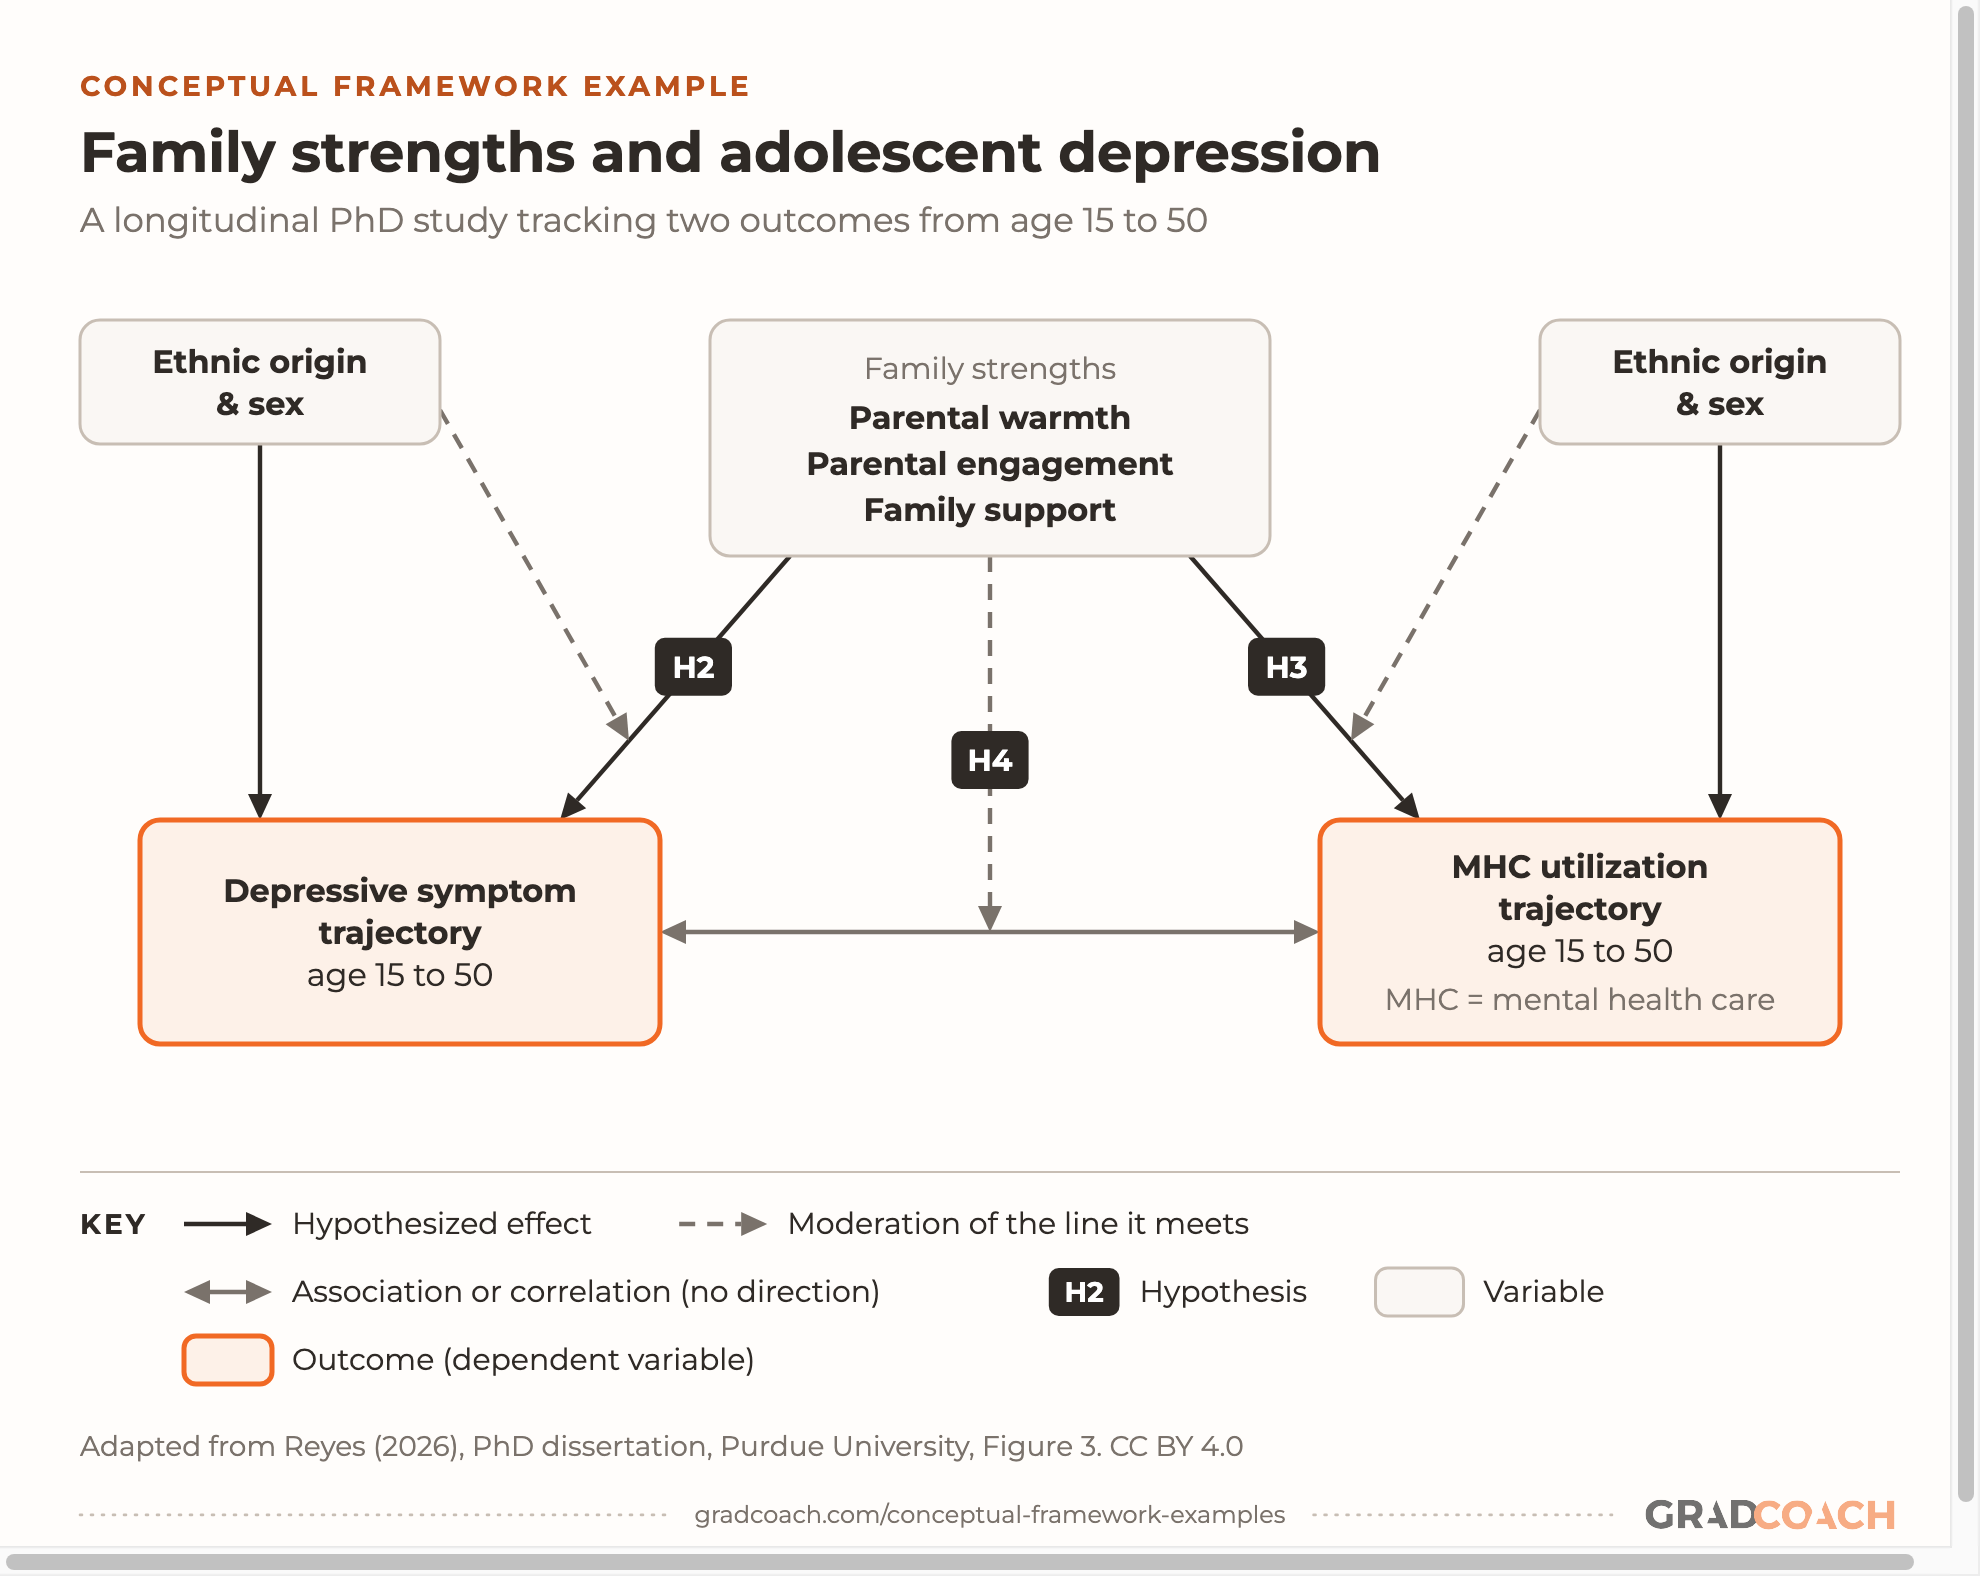
Example 3’s moderator landed on an effect. This one adds a subtler move: moderating an association, a relationship with no direction claimed. It’s from a PhD at Purdue’s Department of Human Development and Family Science, filed in our public health collection. Its first study followed Latine adolescents from a large national dataset into adulthood, tracking depressive symptoms and the use of mental health care over the decades.
Two of its hypotheses show the difference between a direct link and a moderation. Compare what each one claims:
H2 links family strengths to one outcome. It’s worded as an association, but the diagram draws it as a one-way arrow, because family strengths are measured in adolescence, years before the outcomes. H4 does something different: it says family strengths change the strength of the link between the two outcomes, and it says which way. Spelling out “such that the positive association will be strengthened” is what makes a moderation hypothesis testable rather than vague.
The variables and arrows. Family strengths (parental warmth, parental engagement and family support) sit at the top. The two outcomes, the depressive symptom trajectory and the mental health care trajectory from age 15 to 50, sit at the bottom, joined by a two-headed line. Ethnic origin and sex appear twice, once on each side.
Look at where each dashed line ends: two land on arrows, and one on the two-headed line:

The dashed line from family strengths ends on the two-headed line (H4). The dashed lines from ethnic origin and sex end on the arrows from family strengths, which is the study exploring whether those effects differ across subgroups. The original figure labels none of its arrows and names H2 to H4 in its caption, so we added the labels from the hypotheses’ wording, and dashed the H4 line to match the key.
The theory behind it. Reyes builds on the Integrative Risk and Resilience Model, which grows out of Bronfenbrenner’s bioecological theory and places cultural risks and resilience at several levels of a young person’s world, from the family to migration. Family systems theory adds the moderation idea: it’s why the study expects family strengths to change how symptoms and seeking care relate. The dissertation evaluates those broader cultural influences partly by comparing Latines of different national origins, which is where the ethnic origin boxes come from.
Example 5: Two parallel paths
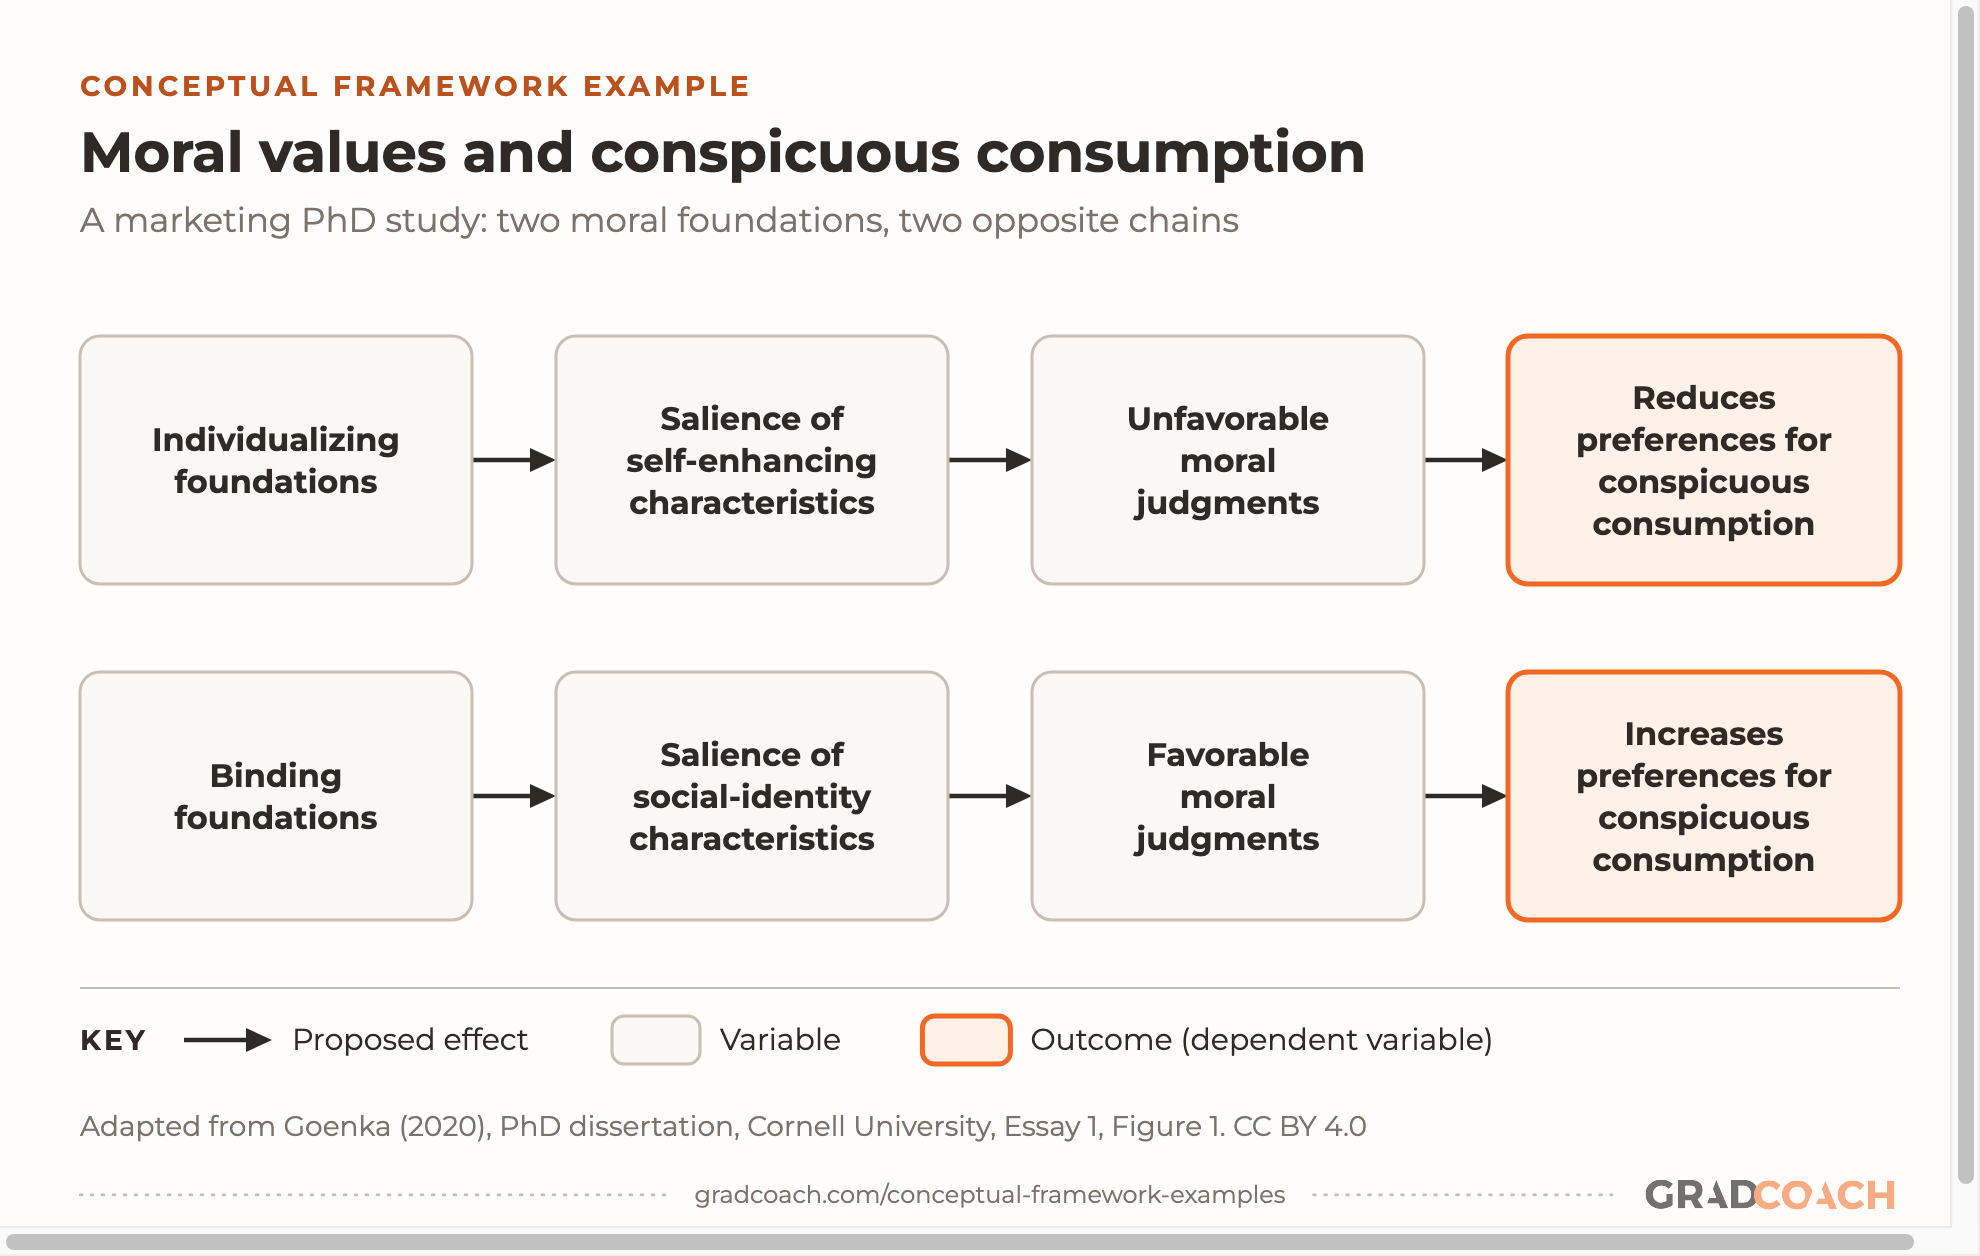
Sometimes the point of a framework is a contrast. This one, from a PhD in management at Cornell (its first chapter, also filed under marketing), proposes two routes to the same behavior, running in opposite directions. It asks why some people approve of conspicuous consumption (buying things partly to be seen with them) and others disapprove.
The study states its expectations as predictions in prose rather than numbered hypotheses. Here’s the last of three for the binding-values route, the bottom row of the diagram:
“Finally” is doing work here: it’s the end of a chain that the two predictions before it build, one step at a time. “Binding values” are the moral values centered on loyalty, authority and purity, as opposed to “individualizing” values centered on care and fairness.
The variables and arrows. Each row is a four-step chain: a set of moral values makes certain features of conspicuous consumption more noticeable, which shapes moral judgments, which shapes preferences. The top row runs from individualizing values to lower preferences; the bottom, from binding values to higher ones.
Read the two rows against each other, box by box:

The theory behind it. Goenka brings together Moral Foundations Theory and the research on conspicuous consumption. The theory supplies the two kinds of values; the consumption research supplies the two kinds of signal a purchase can send (look at me, or look at my group). The framework is where the two literatures meet.
Example 6: A qualitative framework
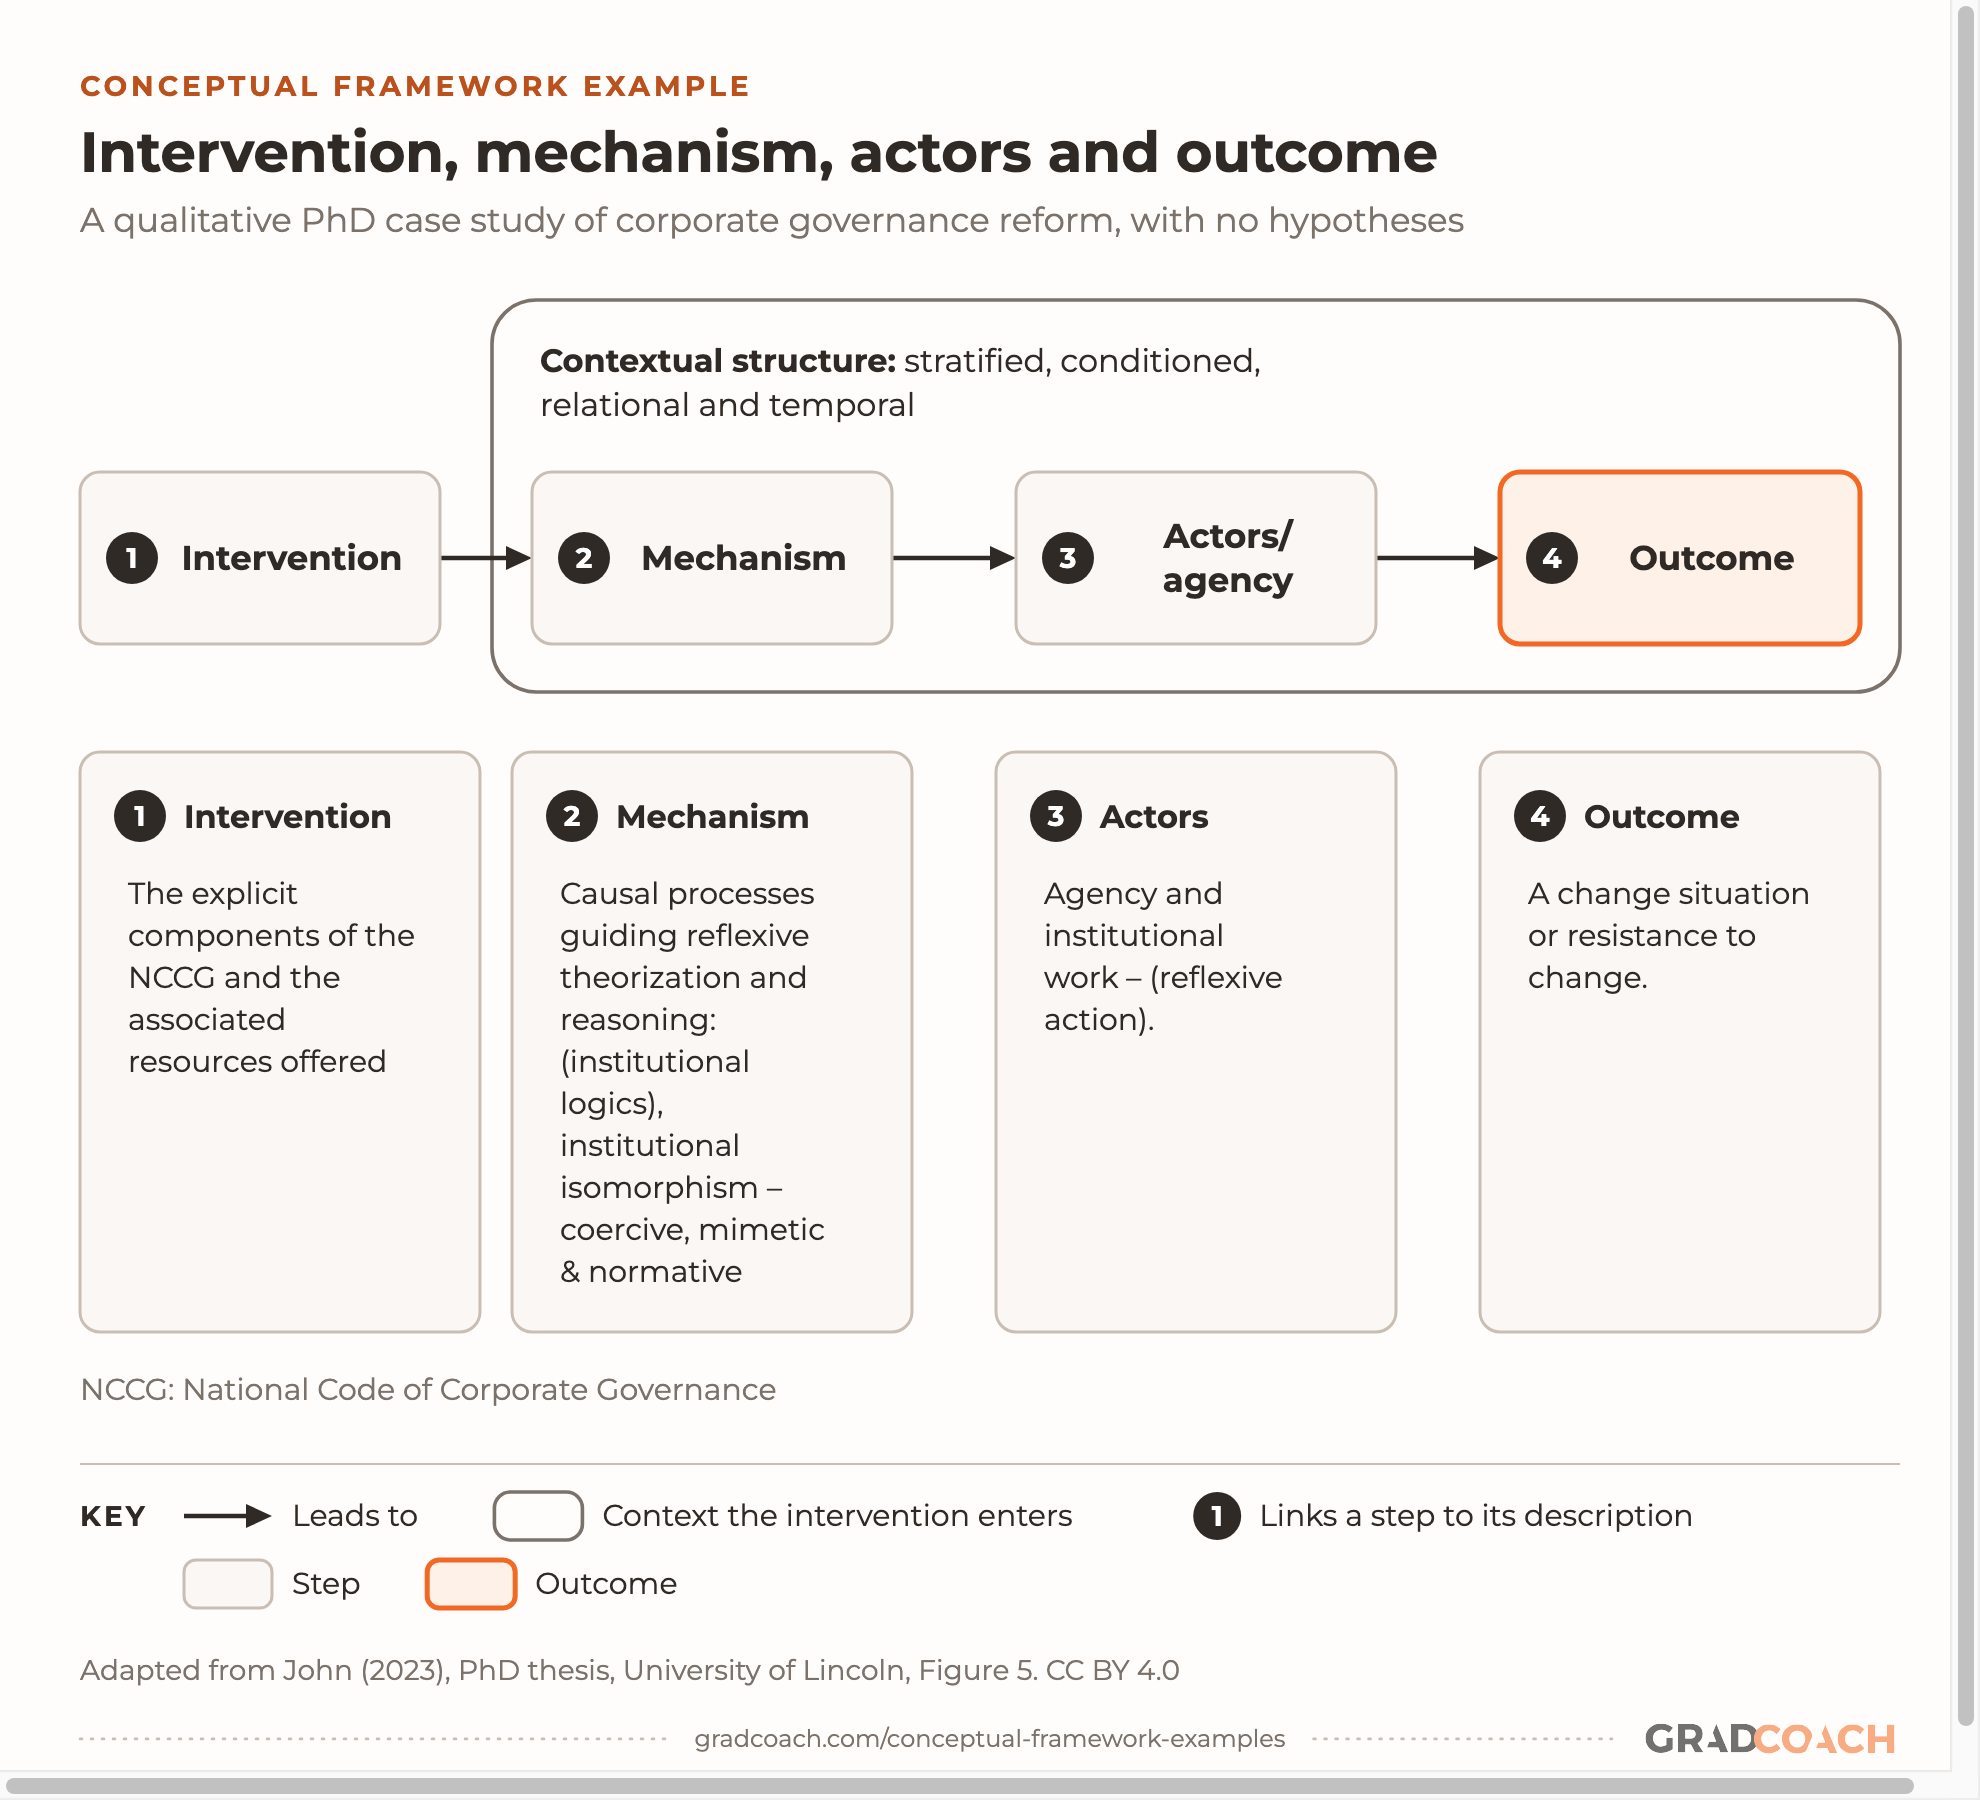
Every framework so far has been quantitative. If your study is qualitative, your framework won’t carry hypotheses, but it can still be a diagram. This business PhD at Lincoln is a qualitative single case study of how corporate governance reform was implemented in Nigeria, and its overarching research question shows why there’s nothing to predict:
“How and why” asks for an explanation of a process, not a measurement. The framework can’t say what the answer will be; it can only say where to look for it.
The concepts and arrows. The figure’s caption calls this an “empirical analytical tool”, and the text calls the same configuration “the theoretical framework”, one more label for the same job. An intervention (the country’s national code of corporate governance) enters a context, triggers mechanisms, is taken up or resisted by actors, and produces an outcome. Each step has a description underneath it, in the thesis’s words.
Notice that the arrows here mean “leads to” in a process, not a hypothesis to test:

We’ve simplified the layout (the original’s oval becomes a rounded boundary, and its dashed leader lines are dropped, since dashes mean moderation in our key). The content is the thesis’s own. The outcome box, “a change situation or resistance to change”, is the clearest sign this isn’t a prediction: either result is a finding.
The theory behind it. The tool builds on realist evaluation’s context-mechanism-outcome idea, which other researchers had extended by adding the intervention and the actors, and it fills the mechanism step with concepts from institutional theory. John uses it alongside critical realism and Archer’s Morphogenetic Approach, and that combination is one of our theoretical framework examples, if you want to see how the theory side is stated.
A conceptual framework template
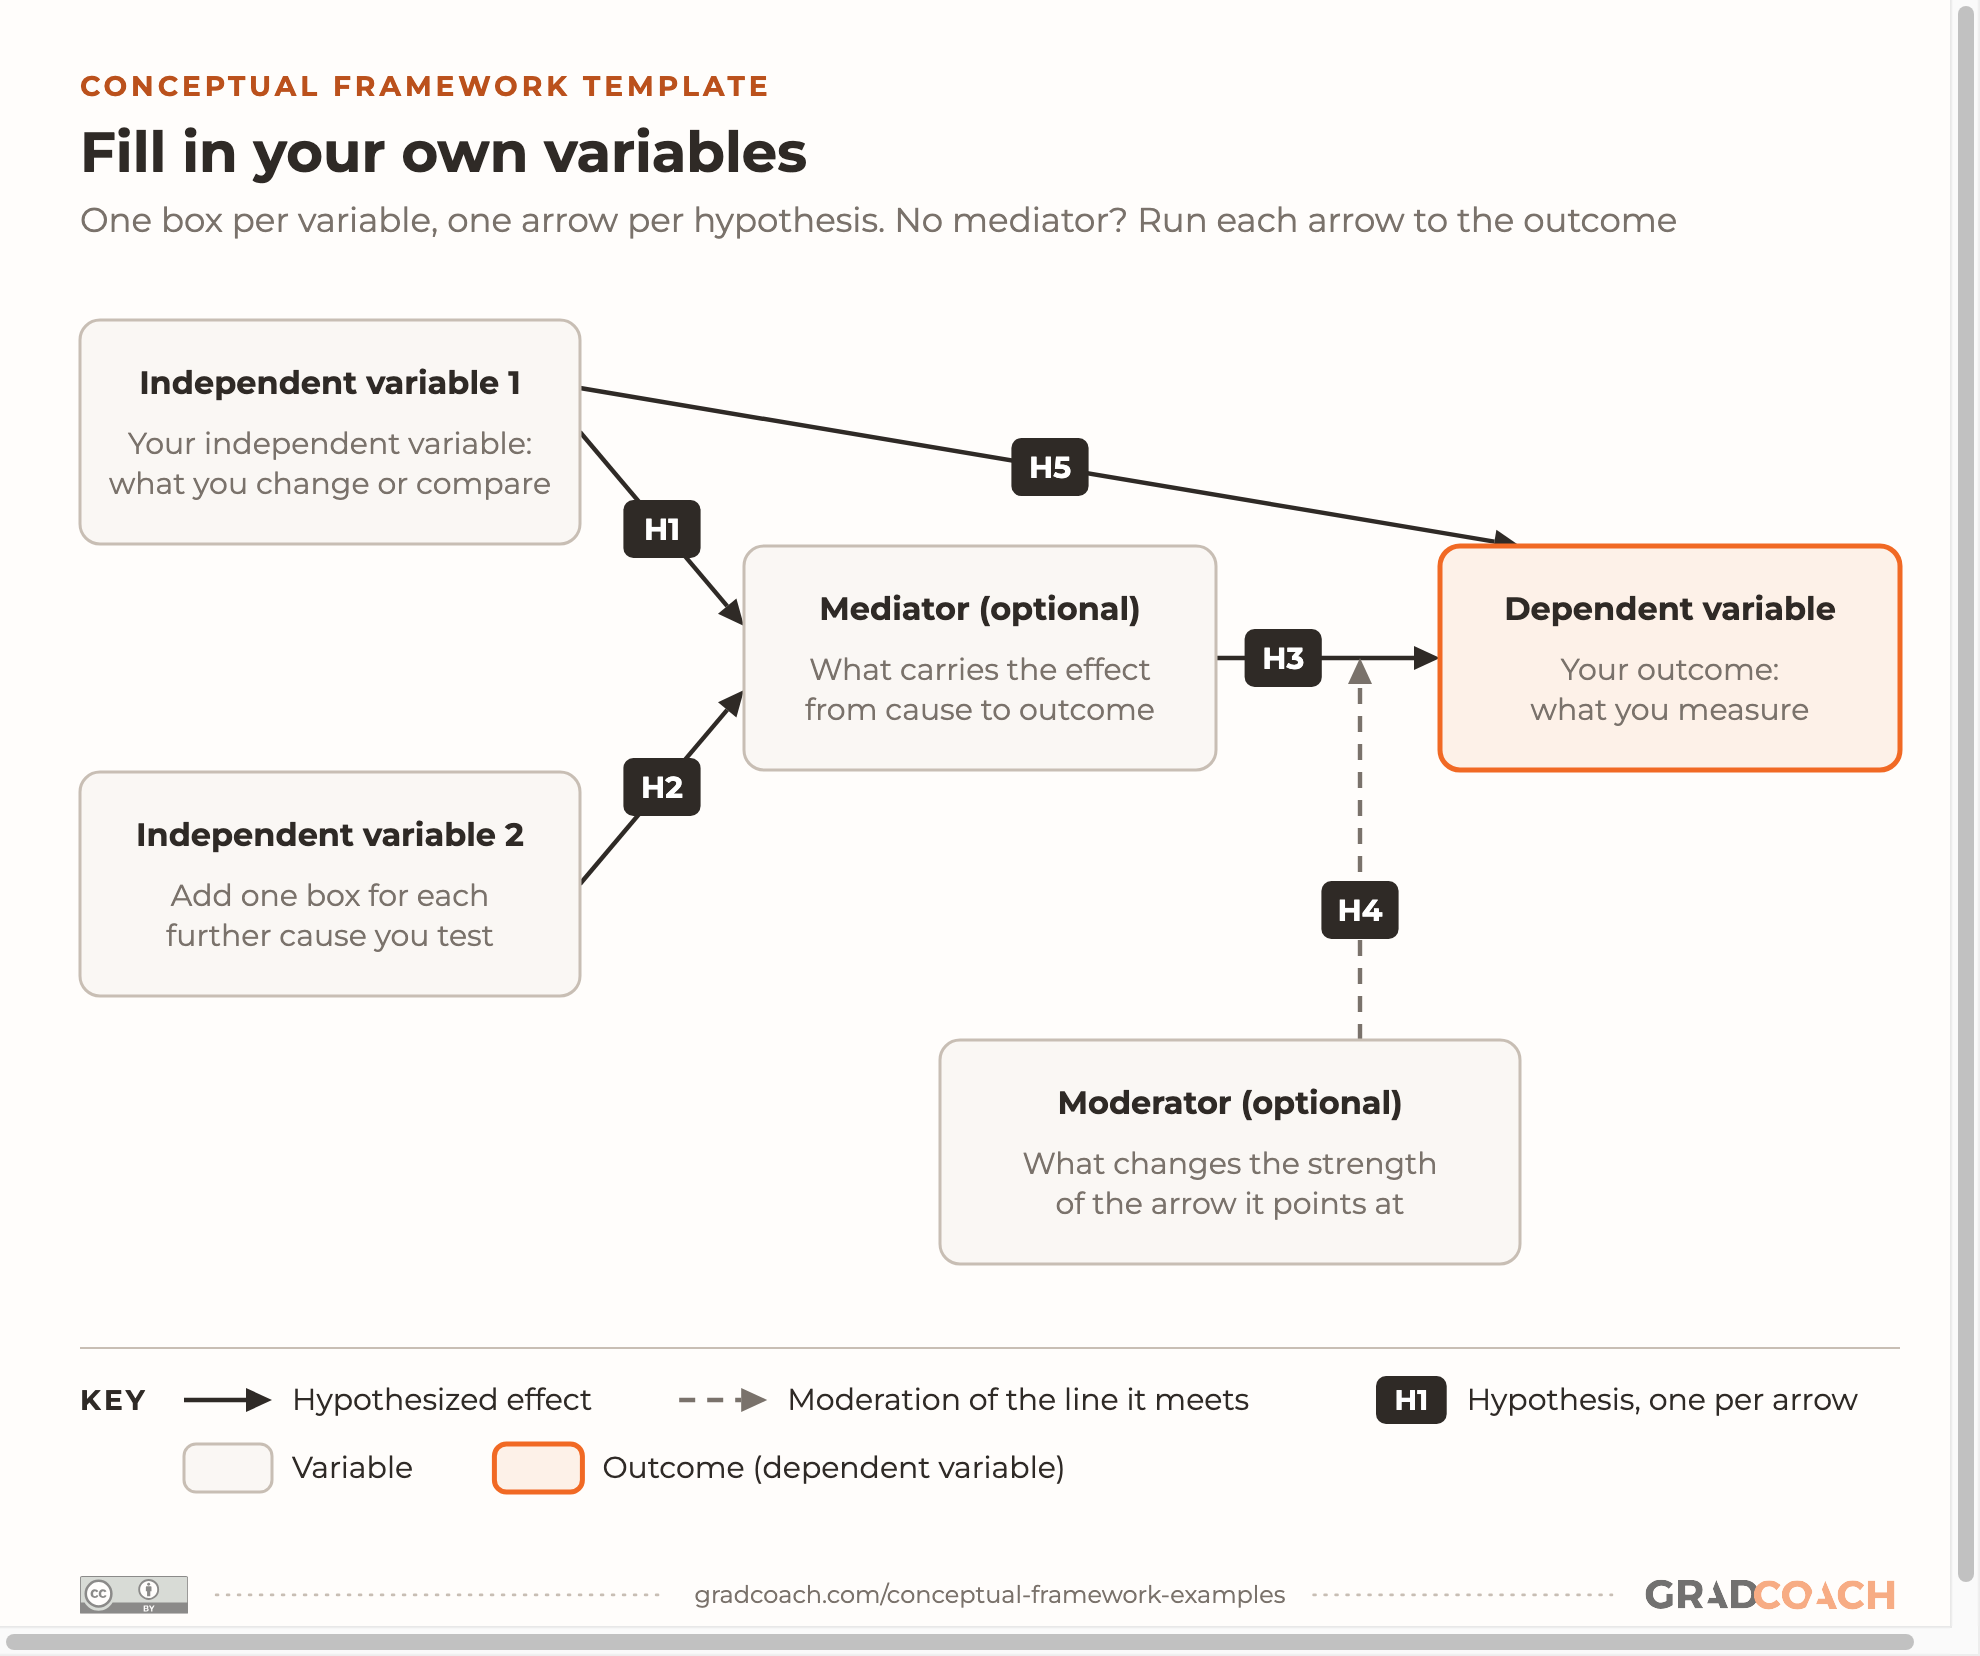
If you’re drawing a quantitative framework, the shape underneath Examples 1 to 3 is the same: causes on the left, an optional mediator in the middle, the outcome on the right, and an optional moderator below. Here it is as a blank template, using the same key:

You can grab an editable version on Canva here: it opens as a template, so you get your own copy to fill in.
To fill it in, work through these steps in order:
- Start from your research question. Write the outcome you’re trying to explain in the orange box first. Everything else on the page exists to explain it.
- Add one box per variable, named as you’ll measure it. “Website usability” beats “technology factors”, because it’s something a survey item can capture.
- Draw only the arrows you can argue for. Each one needs a reason from theory or previous studies, as every arrow in Example 1 did.
- Number every arrow as a hypothesis (or tie it to a research question), then write each hypothesis as one sentence, the way Example 3 did.
- Keep the mediator and moderator only if you’ll test them. If you won’t, delete them and run your arrows straight to the outcome.
- Check each arrow against your analysis plan. In a quantitative framework, if no test in your methodology examines an arrow, it shouldn’t be on the diagram.
In my experience, that last step is the one drafts skip most often. Your framework usually first appears in your proposal, so it’s worth getting right there: every arrow you draw now is something your results chapter will have to report on.
Still have questions?
What are the main parts of a conceptual framework?
A conceptual framework has two parts: the key concepts or variables in your study, and the relationships you expect between them. In a quantitative study that usually means independent variables, a dependent variable (the outcome), and sometimes mediators, moderators or controls, joined by arrows that each stand for a hypothesis or a research question. Most frameworks are drawn as a diagram and explained in writing alongside it.
How do I draw a conceptual framework?
Start with your outcome, then add one box for each variable you’ll measure and one arrow for each relationship you can justify from theory or previous studies. Label each arrow with its hypothesis number and draw a moderator as a line onto the arrow it changes. Keep it to what your study actually tests; a diagram of everything you read is a literature map, not a framework.
Can a qualitative study have a conceptual framework?
Yes, though it looks different. A qualitative conceptual framework maps the concepts, processes or stages your study will explore, with arrows that mean “leads to” or “shapes” rather than hypotheses. Some inductive studies start without one and let their concepts come from the data, so check what your methodology and your advisor expect.
What if my program calls it something else?
Use your program’s term. Dissertations call the same kind of diagram a conceptual framework, a theoretical framework, a research model, a conceptual model or an operational framework. What matters is that it maps your variables or concepts and how they relate; if your program’s template asks for a specific heading, put it there.
Do I need software to draw my framework?
No. Word, PowerPoint, Google Slides or any free diagram tool can draw boxes and arrows well enough for a dissertation. What matters more is legibility: short labels in the words you measure, arrows that don’t cross where you can avoid it, and a key if you use more than one kind of line.
Can’t find your answer here? Ask a Grad Coach directly – the initial chat is free.
Speak with a friendly coach →


Cite-worthy sources
Cite this article
Jansen, D. (2026). Conceptual Framework Examples. Grad Coach. https://gradcoach.com/conceptual-framework-examples/
- Baron, R. M., & Kenny, D. A. (1986). The moderator–mediator variable distinction in social psychological research: Conceptual, strategic, and statistical considerations. Journal of Personality and Social Psychology, 51(6), 1173-1182.
- Goenka, S. (2020). A pluralistic approach to consumer morality [Doctoral dissertation, Cornell University].
- Grant, C., & Osanloo, A. (2014). Understanding, selecting, and integrating a theoretical framework in dissertation research: Creating the blueprint for your “house”. Administrative Issues Journal, 4(2), 12-26.
- Huang, Y. (2019). Undergraduate students’ perceptions of culturally responsive teaching and their sense of belonging and academic self-efficacy in higher education [Doctoral dissertation, Purdue University].
- Jansen, D. (2016). But can I trust you? A quantitative investigation into the antecedents of organisational trust in CFD brokers within [the study’s market] [Unpublished master’s dissertation]. Henley Business School, University of Reading.
- John, J. C. (2023). Exploring the dynamics of corporate governance change: A multi-level study of processes and mechanisms in corporate governance reforms in Nigeria [Doctoral thesis, University of Lincoln].
- Mayer, R. C., Davis, J. H., & Schoorman, F. D. (1995). An integrative model of organizational trust. Academy of Management Review, 20(3), 709-734.
- Reyes, O. A. (2026). Depressive symptoms over time among Latine adolescents: Protective role of family [Doctoral dissertation, Purdue University].
- Verdiguel, N. R. (2024). Phygital design: Boosting luxury purchase intention by enhancing consumer perceptions of in-store usefulness and playfulness [Master’s thesis, Cornell University].
Found this helpful?
Keep us near the top of your Google results.