Research Variables 101:
Independent, Dependent & More
A straightforward explainer for non-statisticians (with examples)


The 30-second summary
A variable is anything in your study that can vary in value, and your research question decides the role each one plays.
- The independent variable is the presumed cause: the thing you change, or the characteristic you compare groups on.
- The dependent variable is the outcome you measure to see whether it responds to the independent variable.
- Control variables are held constant in an experiment, or measured and adjusted for in a survey, so they can’t distort your result.
- Moderators and mediators add a third variable: a moderator changes how strongly one variable affects another; a mediator explains how.
- A confounder is linked to both variables, so it can create, hide or exaggerate an apparent effect between them.
Your variables’ types decide your statistical tests, and our free statistics cheat sheet shows which test fits which.
Navigate
Mix up your variables and the mistake doesn’t stay put. Your hypotheses point the wrong way, your analysis tests the wrong relationship, and your committee is likely to spot it as soon as they read your methodology. It’s an easy error to make in a quantitative study, and it gets expensive to fix late.
Having guided 10,000+ students through their research, we’ve found that variable mix-ups often start in the research question, when it never quite says what’s meant to affect what. In this post, I’ll explain each type of variable, carry one simple experiment through all of them so you can see exactly how they differ, and show you some examples of how real dissertations handle theirs.
What (exactly) is a variable?
A variable is any characteristic that varies from one person, place, time or condition to the next. The dose of a medicine is a variable, because it can be higher or lower. So are age, income, job satisfaction and test scores, because people differ on each of them.
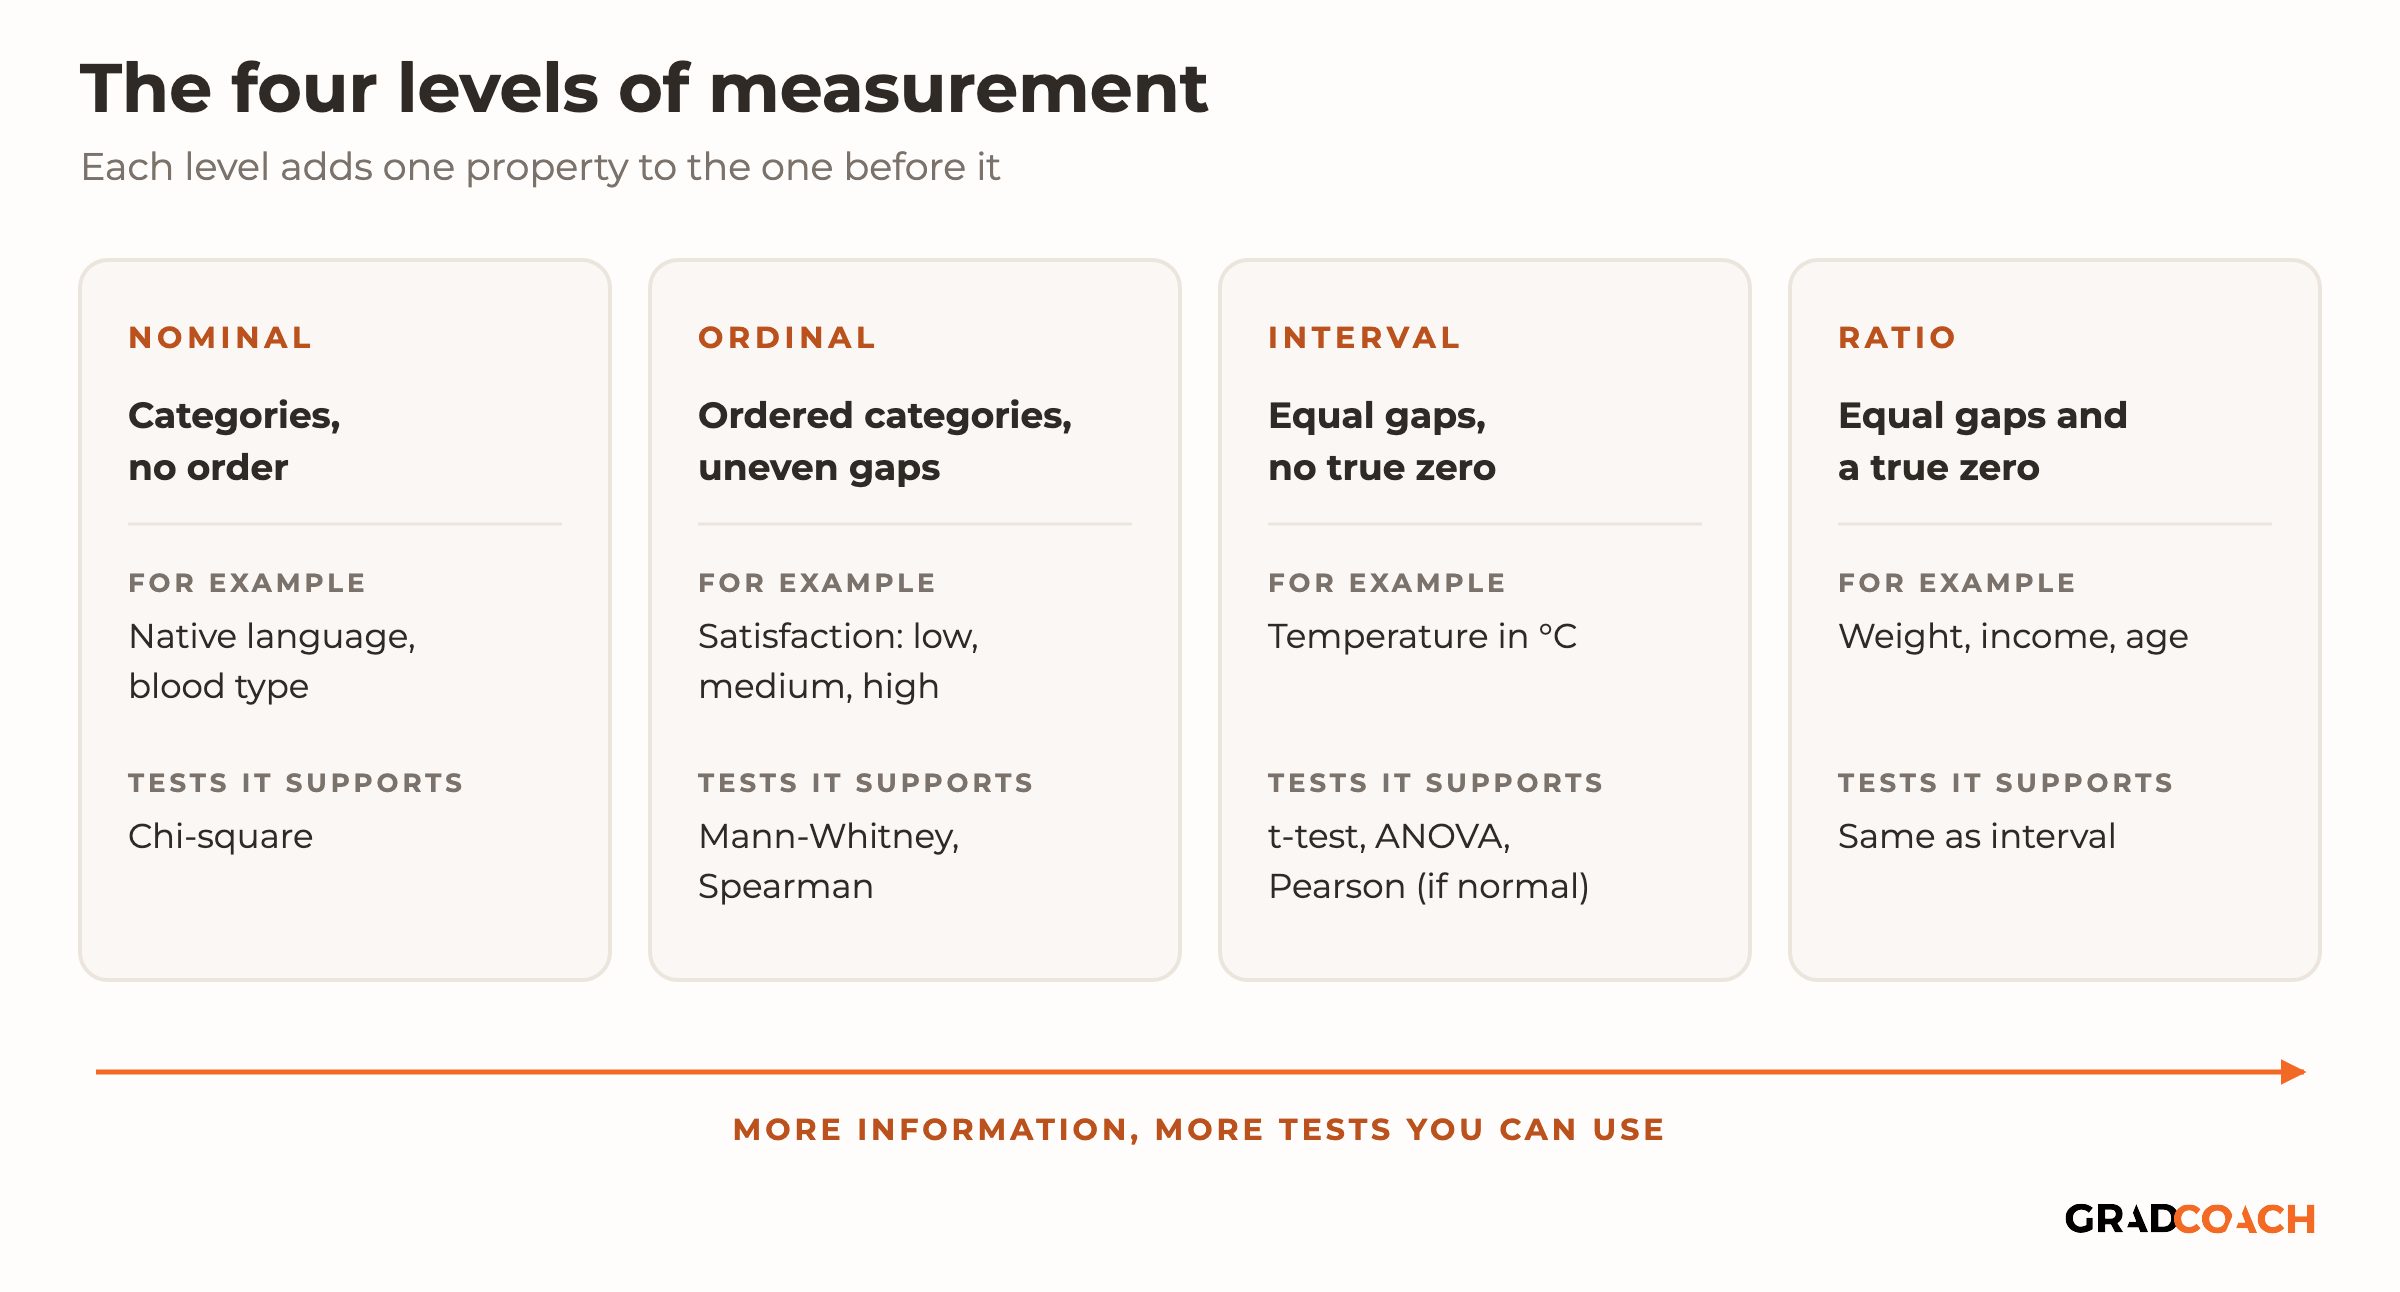
Variables also differ in type. Some are categories (gender, the teaching method a class gets), others are numbers on a scale (age, a test score), and the type decides which statistical tests you can run. Our guide to levels of measurement explains the four types, and the drawing below sums them up:

Research gets interesting when you ask how one variable relates to another. For example:
- How someone’s age relates to their sleep quality
- How different teaching methods affect learning outcomes
- How diet affects weight gain or loss
Each of those questions has a presumed cause and a presumed effect, and that’s what the labels in the rest of this post describe. In experimental studies especially, the aim is to understand cause and effect: you change one variable, hold others steady, and watch what happens to the outcome. Three variables do most of that work (independent, dependent and control), so let’s start with those.
What is an independent variable?
The independent variable is the presumed “cause” in a relationship between two or more variables. When it changes, you expect another variable to change in response.
For example:
- Increasing the dosage of a medication (variable A) could lead to better or worse health outcomes for a patient (variable B)
- Changing a teaching method (variable A) could change the test scores students earn on a standardized test (variable B)
- Changing your diet (variable A) could lead to weight loss or gain (variable B)
In each case, variable A is the independent variable. You’ll also see it called an explanatory variable (it explains an outcome) or a predictor variable (it predicts the value of another variable), and regression write-ups often use “predictor”.
Not every independent variable is like these three, though. A dose, a teaching method and a diet are all things a researcher can set, so they can be manipulated in an experiment. Others, such as age, gender or years of experience, can’t be assigned by the researcher. You can only compare people who already differ on them, which matters a great deal for what you can claim later, as you’ll see in the next section.
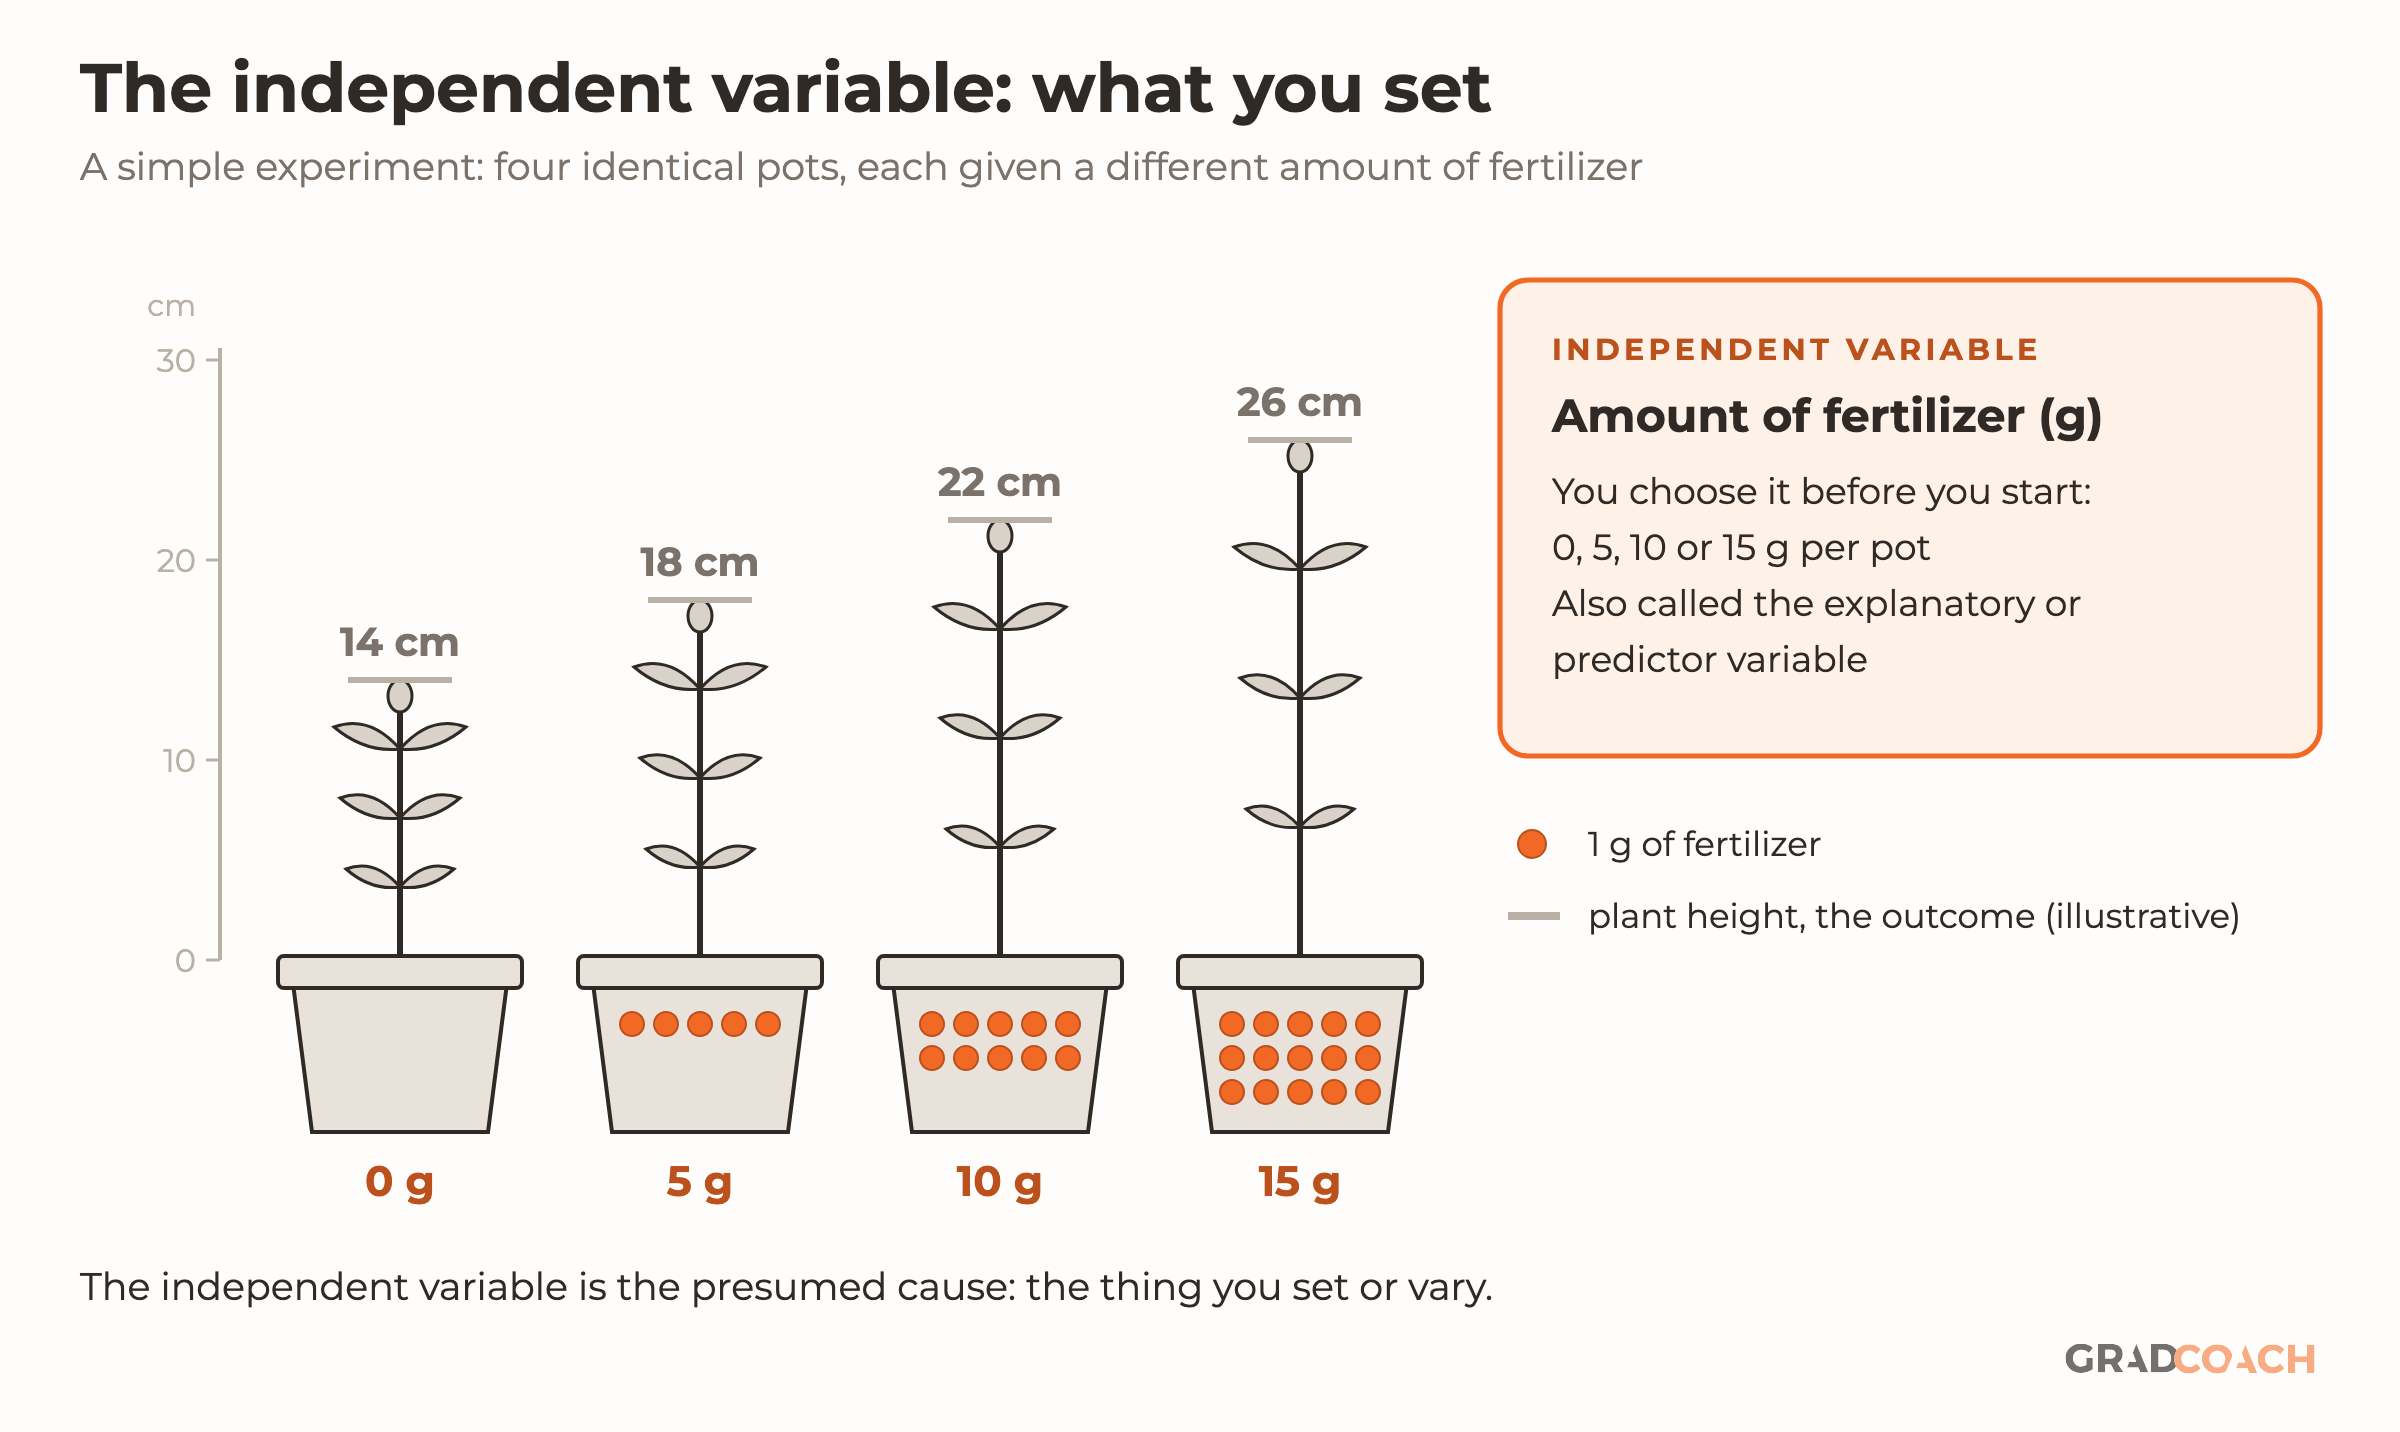
To make this concrete, picture the simple experiment I’ll carry through the rest of this post: four pots of the same plant, each given a different amount of fertilizer. The amount of fertilizer is the independent variable:

What is a dependent variable?
If the independent variable is the cause, the dependent variable is the effect, or the outcome. It’s the variable you expect to change as a result of a change in the independent variable, which is why it “depends” on it. You’ll also see it called the outcome, response or criterion variable.
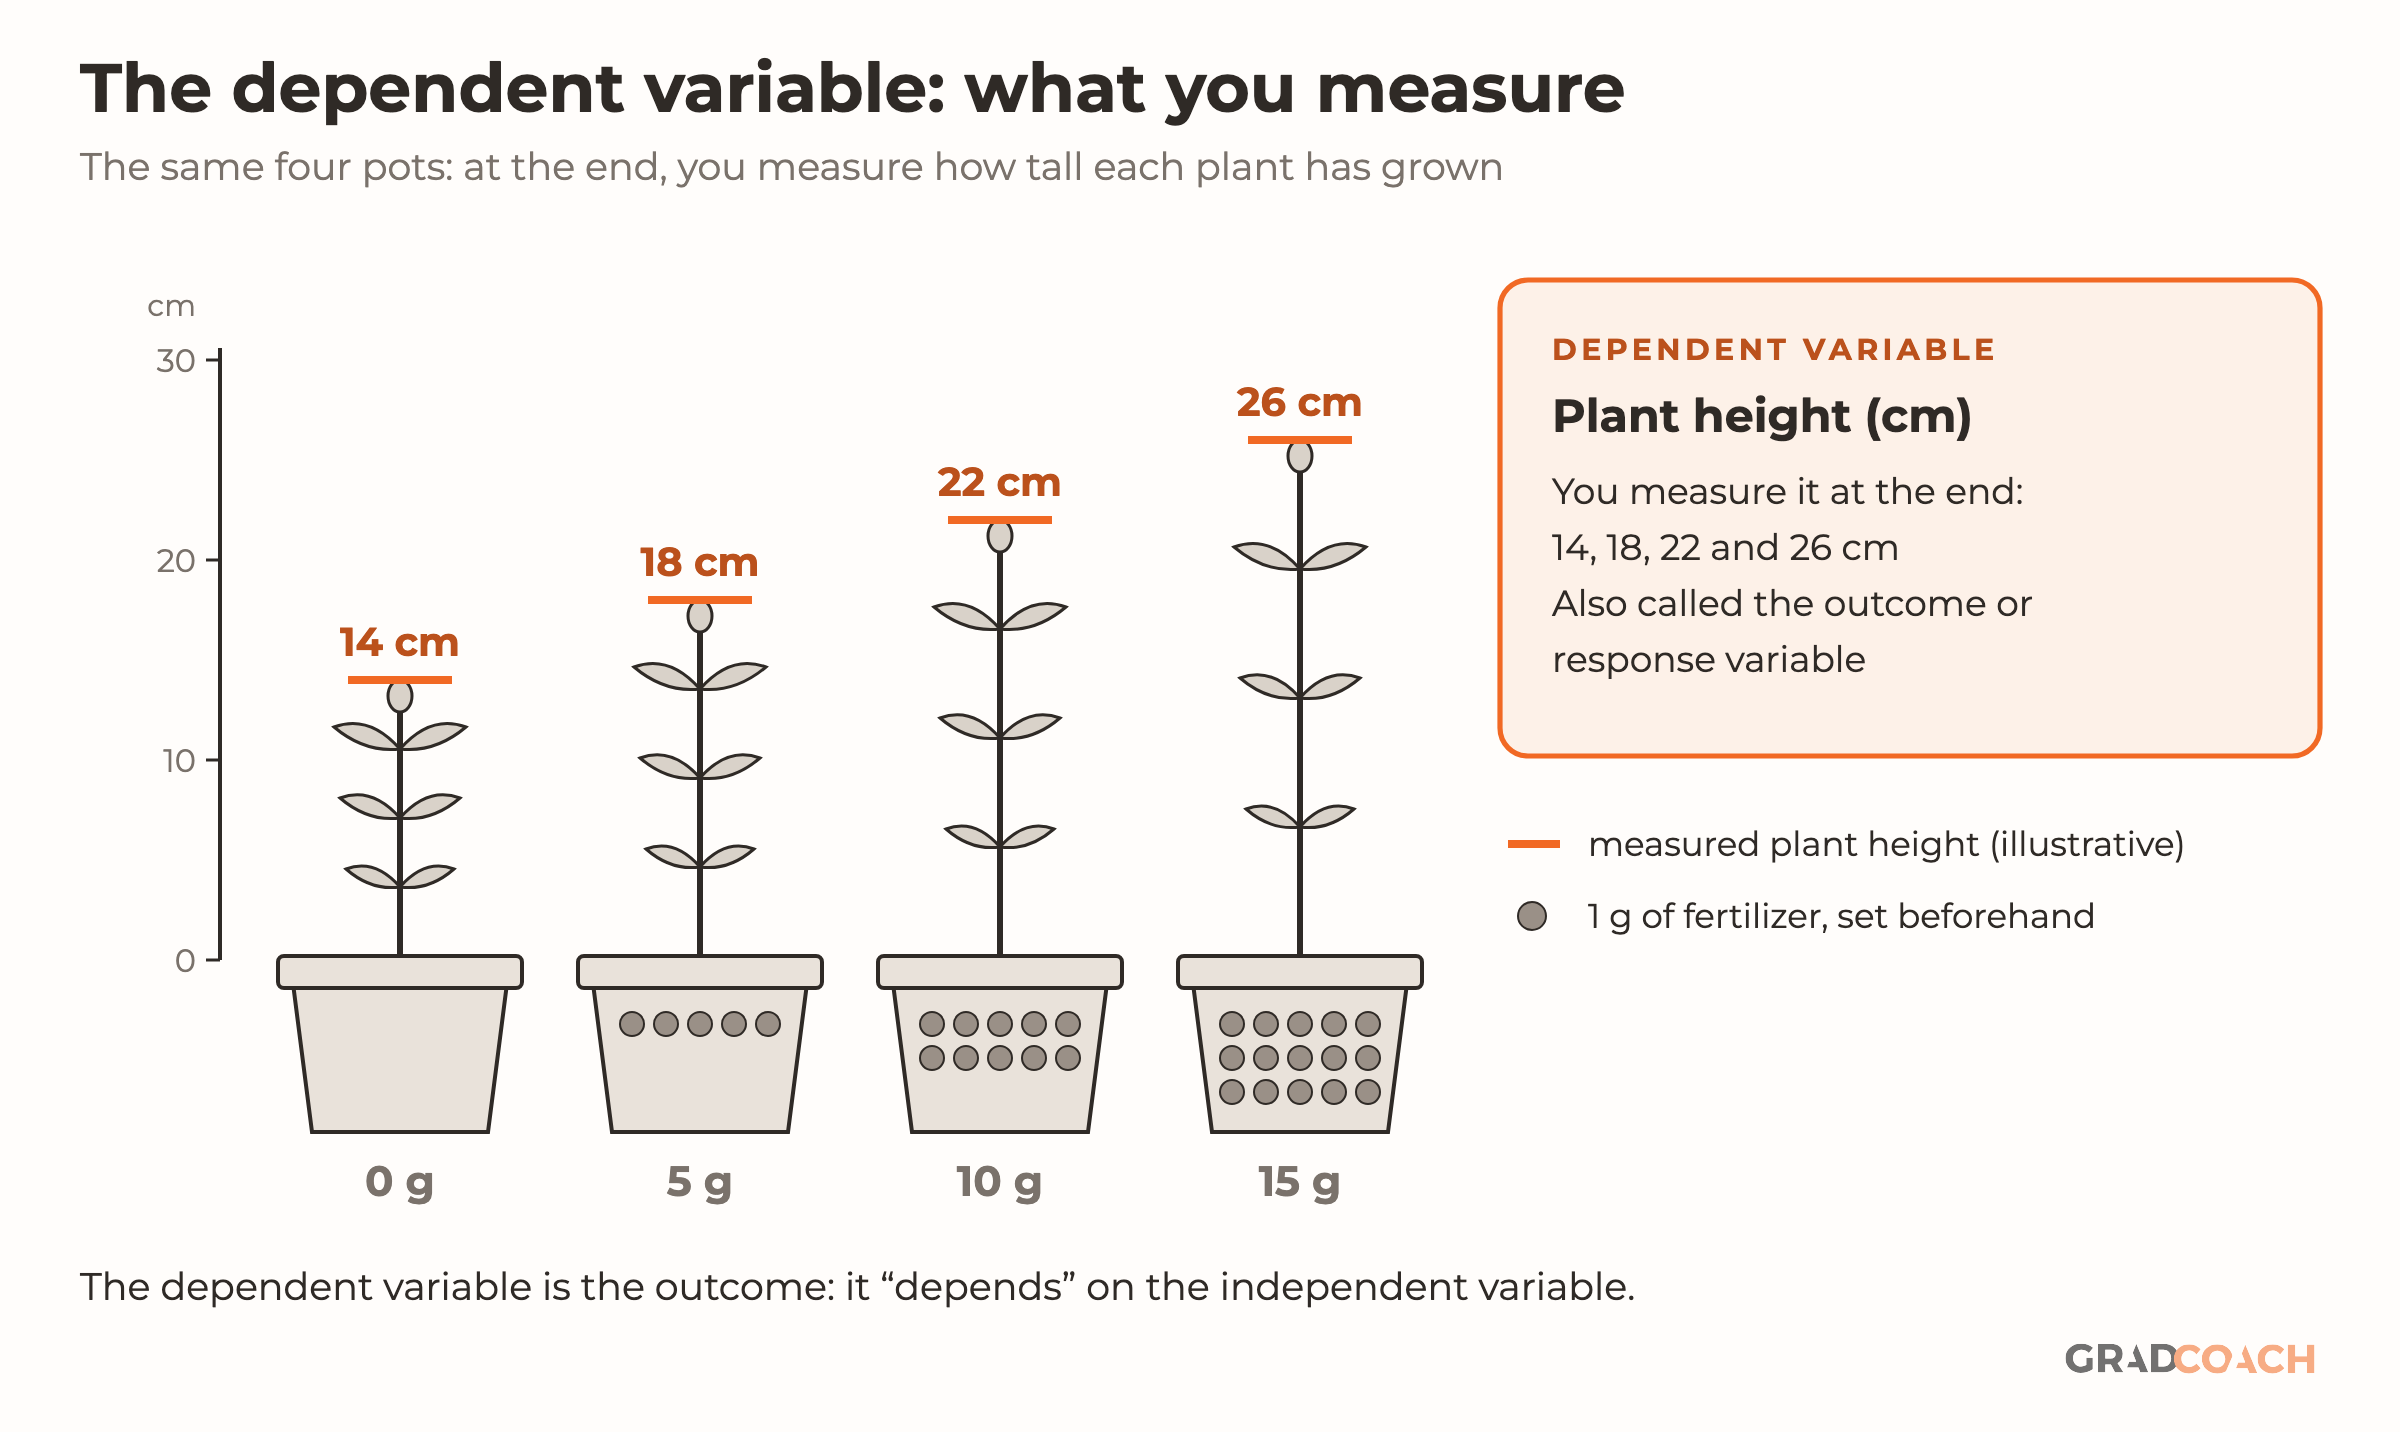
In the fertilizer experiment, the dependent variable is how tall each plant grows:

Going back to the three examples from the last section:
- Health outcomes (DV) could be affected by dosage changes of a medication (IV)
- Students’ scores (DV) could be affected by teaching methods (IV)
- Weight gain or loss (DV) could be affected by diet (IV)
In a study, the dependent variable is the thing you measure carefully, because any change in it is your result. That’s harder than it sounds. It isn’t always easy to measure an outcome reliably, and it’s even harder to be sure that the independent variable caused the change rather than something else.
As the saying goes, correlation is not causation. Two variables can move together without one causing the other. You might find that the number of people who own a certain brand of car is correlated with the number of people in a certain type of job. That doesn’t mean owning the car gets you the job, or the reverse. A third factor, such as income or age group, could be driving both. That third factor is called a confounding variable, and it has its own section below.
To be confident that an independent variable causes a change in a dependent variable (X causes Y), you’ll usually need an experimental design, where you control the conditions and randomly assign who gets what. Even then, what happens in the lab doesn’t always translate to the real world.
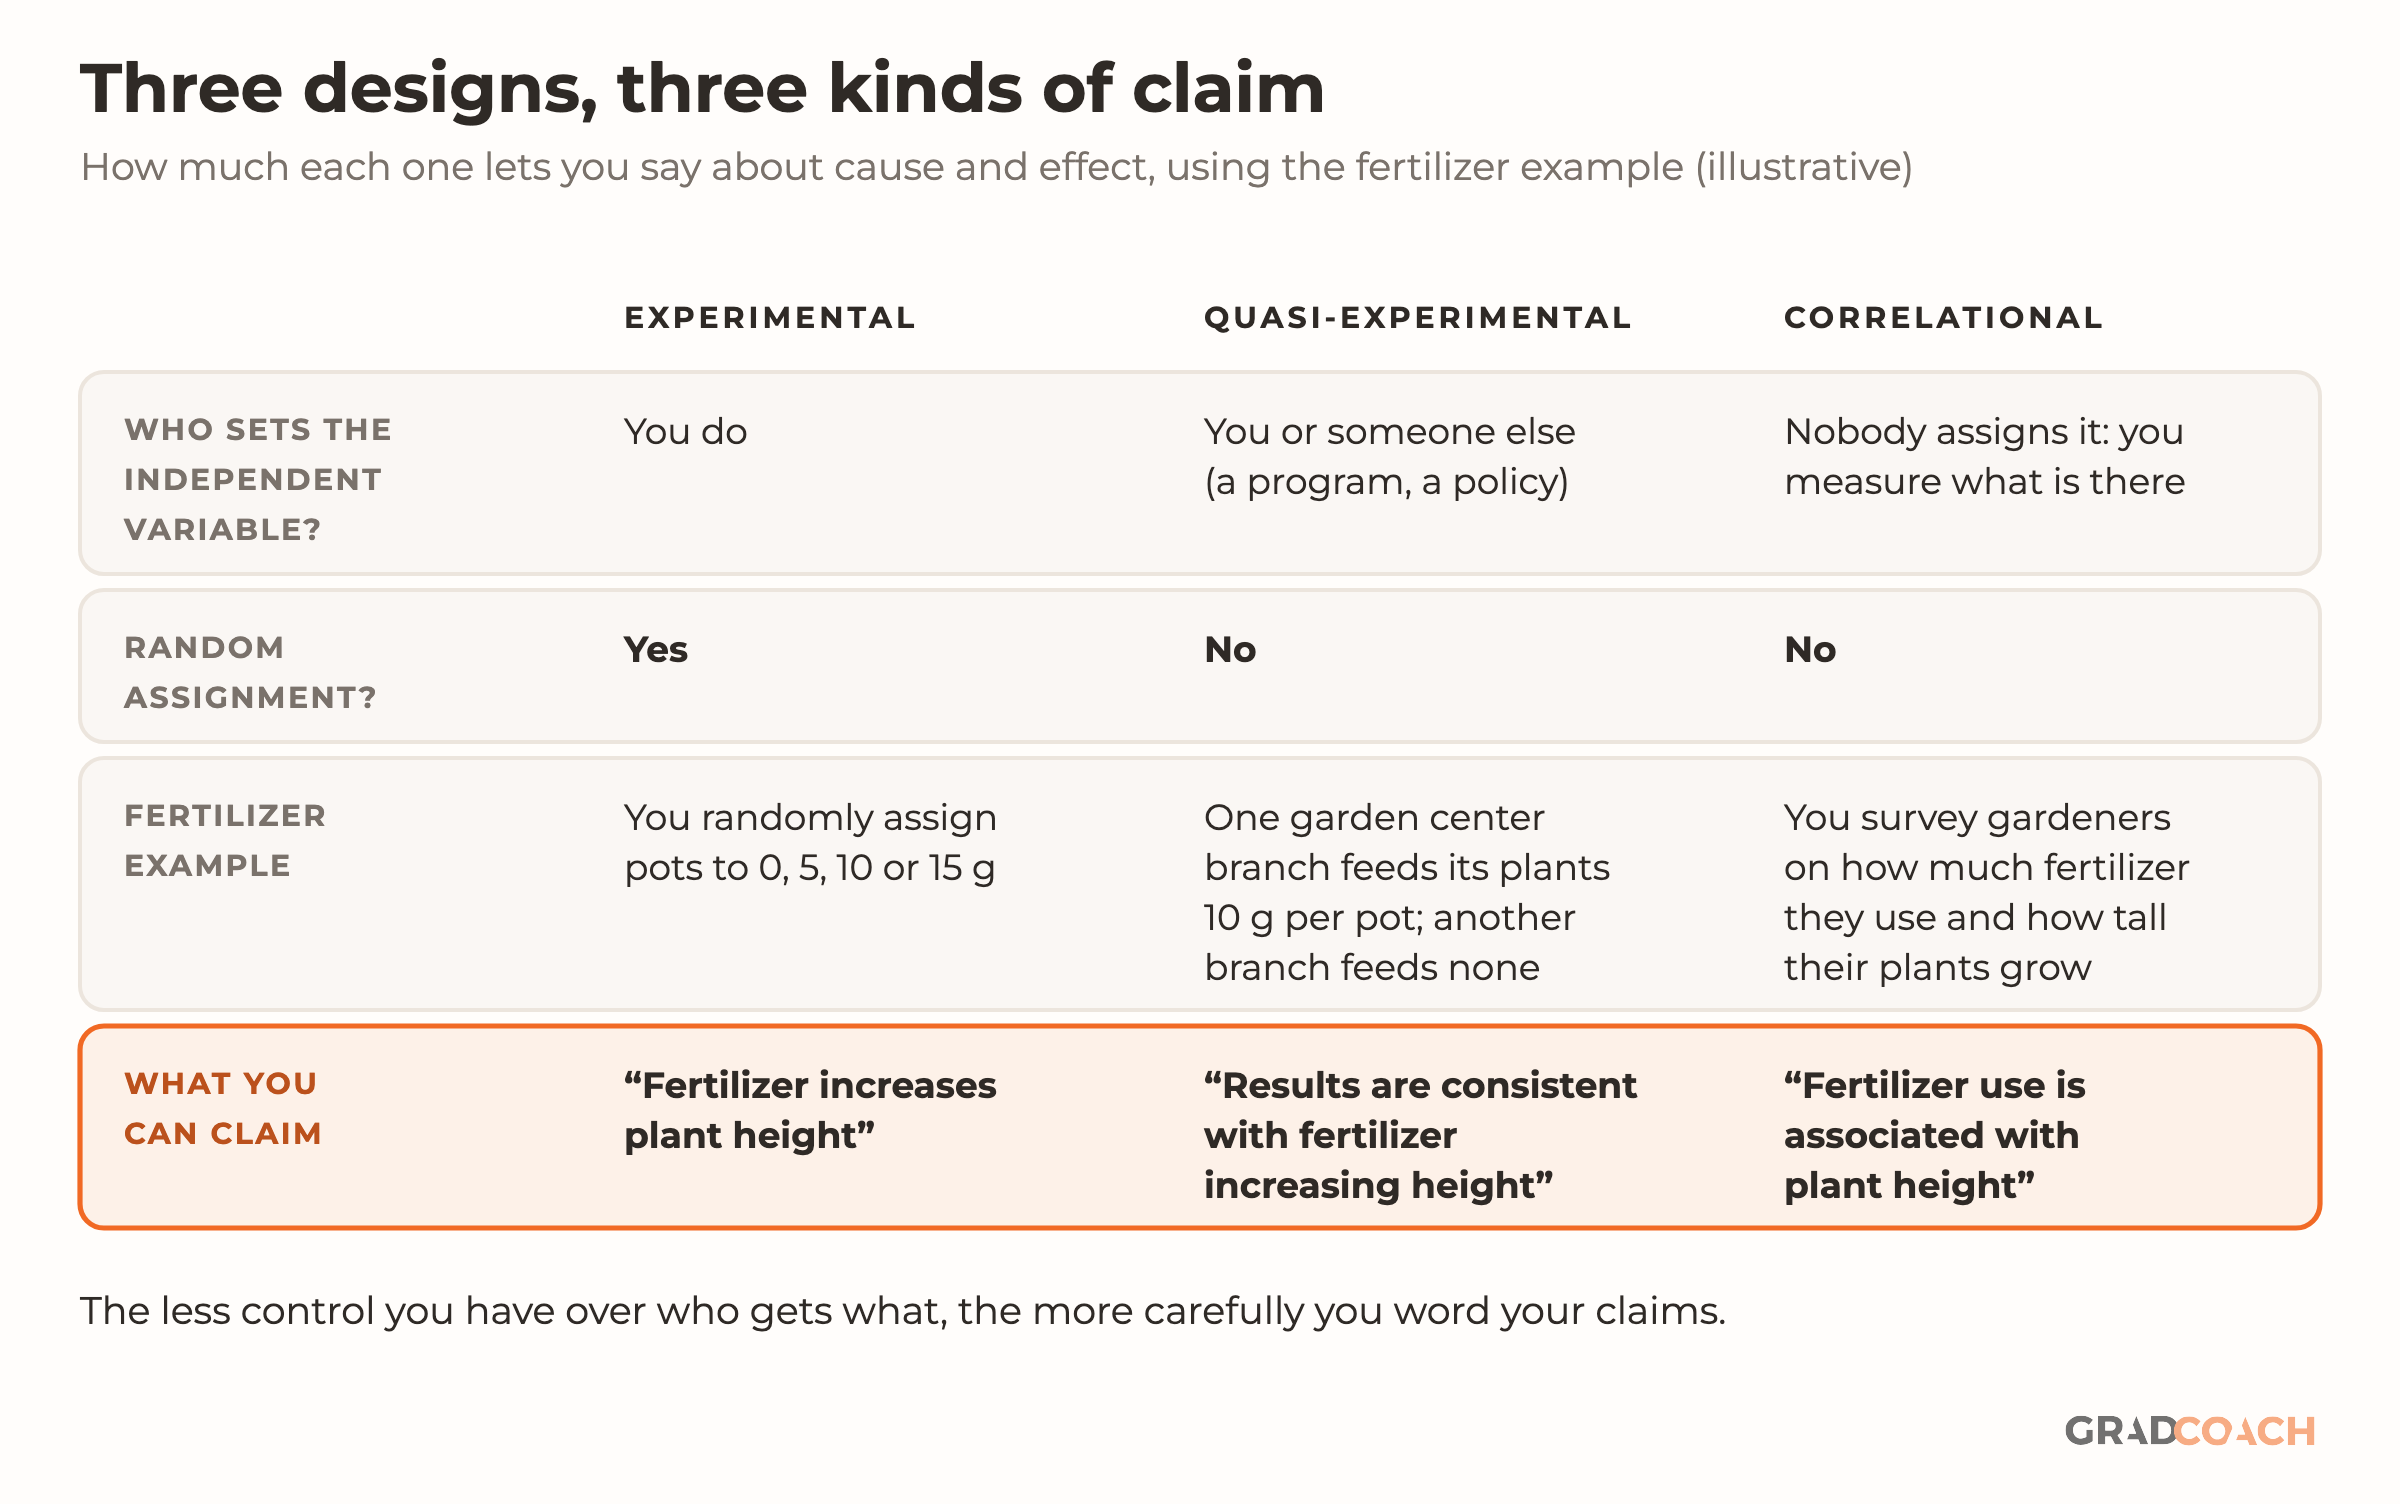
The alternatives are correlational research, where nobody manipulates anything, and quasi-experimental research, where a change is introduced (by you or someone else) but nobody randomly assigns who gets it. Both can run on a much larger scale, in real settings. Here’s how the three compare, using the fertilizer experiment:

So in a correlational or quasi-experimental study, word cause and effect carefully, and acknowledge those limitations in your write-up. In my experience, the most common version of this mistake in quantitative dissertations is a correlational study reported in the language of an experiment.
What is a control variable?
In an experiment, a control variable (or controlled variable) is a variable you intentionally hold constant so that it can’t influence the result. It stays the same for every participant and every condition. In other words, it’s the variable that isn’t allowed to vary (tough life).
Control variables exist because of the problem above: it’s hard to isolate the effect of your independent variable when other factors are changing too. So you hold as many of those factors steady as you reasonably can. Depending on the study, the variables you may need to control include:
- Temperature
- Time of day
- Lighting
- Instructions given to participants
- Noise or distractions
There’s no generic list to work from, because the right controls depend on your study. Think through everything that could vary in your setting and affect your outcome, then decide how you’ll handle each one. A good shortcut is to look at published studies close to yours and note which variables they controlled for.
Put the two pot drawings from earlier together and add what stays fixed: the type of plant, the type of fertilizer, the amount of sunlight and the pot size are the same in every pot, so they’re the controlled variables. Here’s the full picture:

Outside the lab, you often can’t hold things constant. In a survey, you usually can’t make every respondent the same age. Instead, you measure the variable and adjust for it in your analysis, which is called statistical control. An education doctorate from Valdosta State, comparing business and education leaders, builds it straight into its research question:
Notice the phrase “after controlling for”. It names two control variables, age and length of employment, and the wording suggests the comparison between business and education leaders is made with both taken into account. If your study is a survey or uses existing records, name your control variables in your research question or hypotheses in the same way, so your committee can see you’ve thought about them.
You won’t be able to control every possible variable, so for the ones you can’t, acknowledge their potential impact and factor it into the conclusions you draw. Every study has its limitations, so don’t let a troublesome variable stall you. Just don’t ignore it either.
How to tell which is which
When you’re looking at your own research question, the labels can feel slippery. I’d start with three checks:
- Which variable comes first in time? A cause has to come before its effect, so the variable that happens or is set first is usually the independent variable.
- Which one do you set, or group people by? If you assign it, or sort participants by it, it’s usually your independent variable.
- Which one do you measure as the result? The variable you collect at the end, to see whether it changed, is your dependent variable.
If all three checks point the same way, you have your answer. If they don’t, your research question probably doesn’t yet say what you think affects what, and that’s worth fixing before anything else.
The wording of a research question usually gives the roles away. Here are some examples based on five research questions from successful, published dissertations (more in our collection of real research questions), with the variables each one suggests:
| Research question | Independent variable | Dependent variable |
|---|---|---|
| “What is the impact of temperature setting on the effectiveness of AutoDoc?” (Kou, Purdue PhD, 2026) | The temperature setting of the language model | How effective AutoDoc’s documents are |
| “How do subtitle errors impact the evaluation of the speaker and the content?” (Kadoma, Cornell PhD, 2026) | Subtitle errors | How listeners rate the speaker and the content |
| “…a significant difference in the academic achievement of students who participated in the after-school program compared to the students who did not…” (Green, Valdosta State, 2022) | Taking part in the after-school program, or not | Scores on the state English language arts test |
| “Is there a statistically significant relationship between attending library instruction and GPA for first-time, full-time freshman?” (Wright, Valdosta State, 2019) | Attending library instruction | GPA |
| “Are selected athletic training clinical education variables and faculty demographic characteristics significant predictors of the three-year aggregate [Board of Certification] pass rate…” (Walters, Valdosta State, 2020) | Clinical education variables and faculty demographics | The programs’ three-year pass rate |
Notice the phrases that give each role away: “the impact of X on Y”, “a difference in Y between groups of X”, “X as predictors of Y”.
The library question is the trickiest, because “a relationship between” doesn’t say which way the influence runs. The order in time settles it: students attend library instruction before their GPA is recorded, so instruction is the independent variable.
Bear in mind, too, that none of the last three questions suggests anyone was randomly assigned: students chose the after-school program and the library sessions themselves, so studies like those can show a relationship, not prove a cause.
“Effectiveness” in the first row is also worth a second look. A dependent variable has to be measurable, and in its temperature experiment, Kou’s thesis scores AutoDoc’s documents on correctness, uniqueness, overlap and the number of snippets. If your dependent variable is a broad idea like effectiveness or satisfaction, spell out how you’ll measure it.
Once the roles are clear, write them into your methodology chapter in plain words. The extract below, from a business PhD at Lincoln, manages all three roles in a few sentences:
Notice how the section names the dependent variable first, then traces the nine independent variables back to the two theories they came from, then says exactly how each control variable was coded. A reader never has to guess which role a variable plays. Do the same in your methodology chapter, ideally in a table if you have more than a handful of variables.
A variable’s role can even change within one thesis. In Luong’s regression model, income is a control variable. In a separate analysis (a MANOVA, which compares groups on several outcomes at once, testing hypothesis H11), income becomes the independent variable, and six of the regression’s independent variables (price value, compatibility and the rest) become the dependent variables. That hypothesis was rejected, but the point stands. The role belongs to the analysis, not the variable, so name it for each one.
Other types of variables
Independent, dependent and control variables are the ones you’ll meet most often, but they’re not the only ones. Four more come up regularly as you design a study:
The first three are all “third variables”: each one changes how you read the relationship between your independent and dependent variable, in a different way. Latent variables are a measurement problem rather than a relationship one. We’ll take them in that order.
What is a moderating variable?
A moderating variable changes the strength or direction of the relationship between an independent variable and a dependent variable. In the words of Baron and Kenny’s classic paper on the distinction, a moderator “affects the direction and/or strength of the relation” between the two. Put simply, it tells you when, or for whom, the effect is bigger, smaller or even reversed.
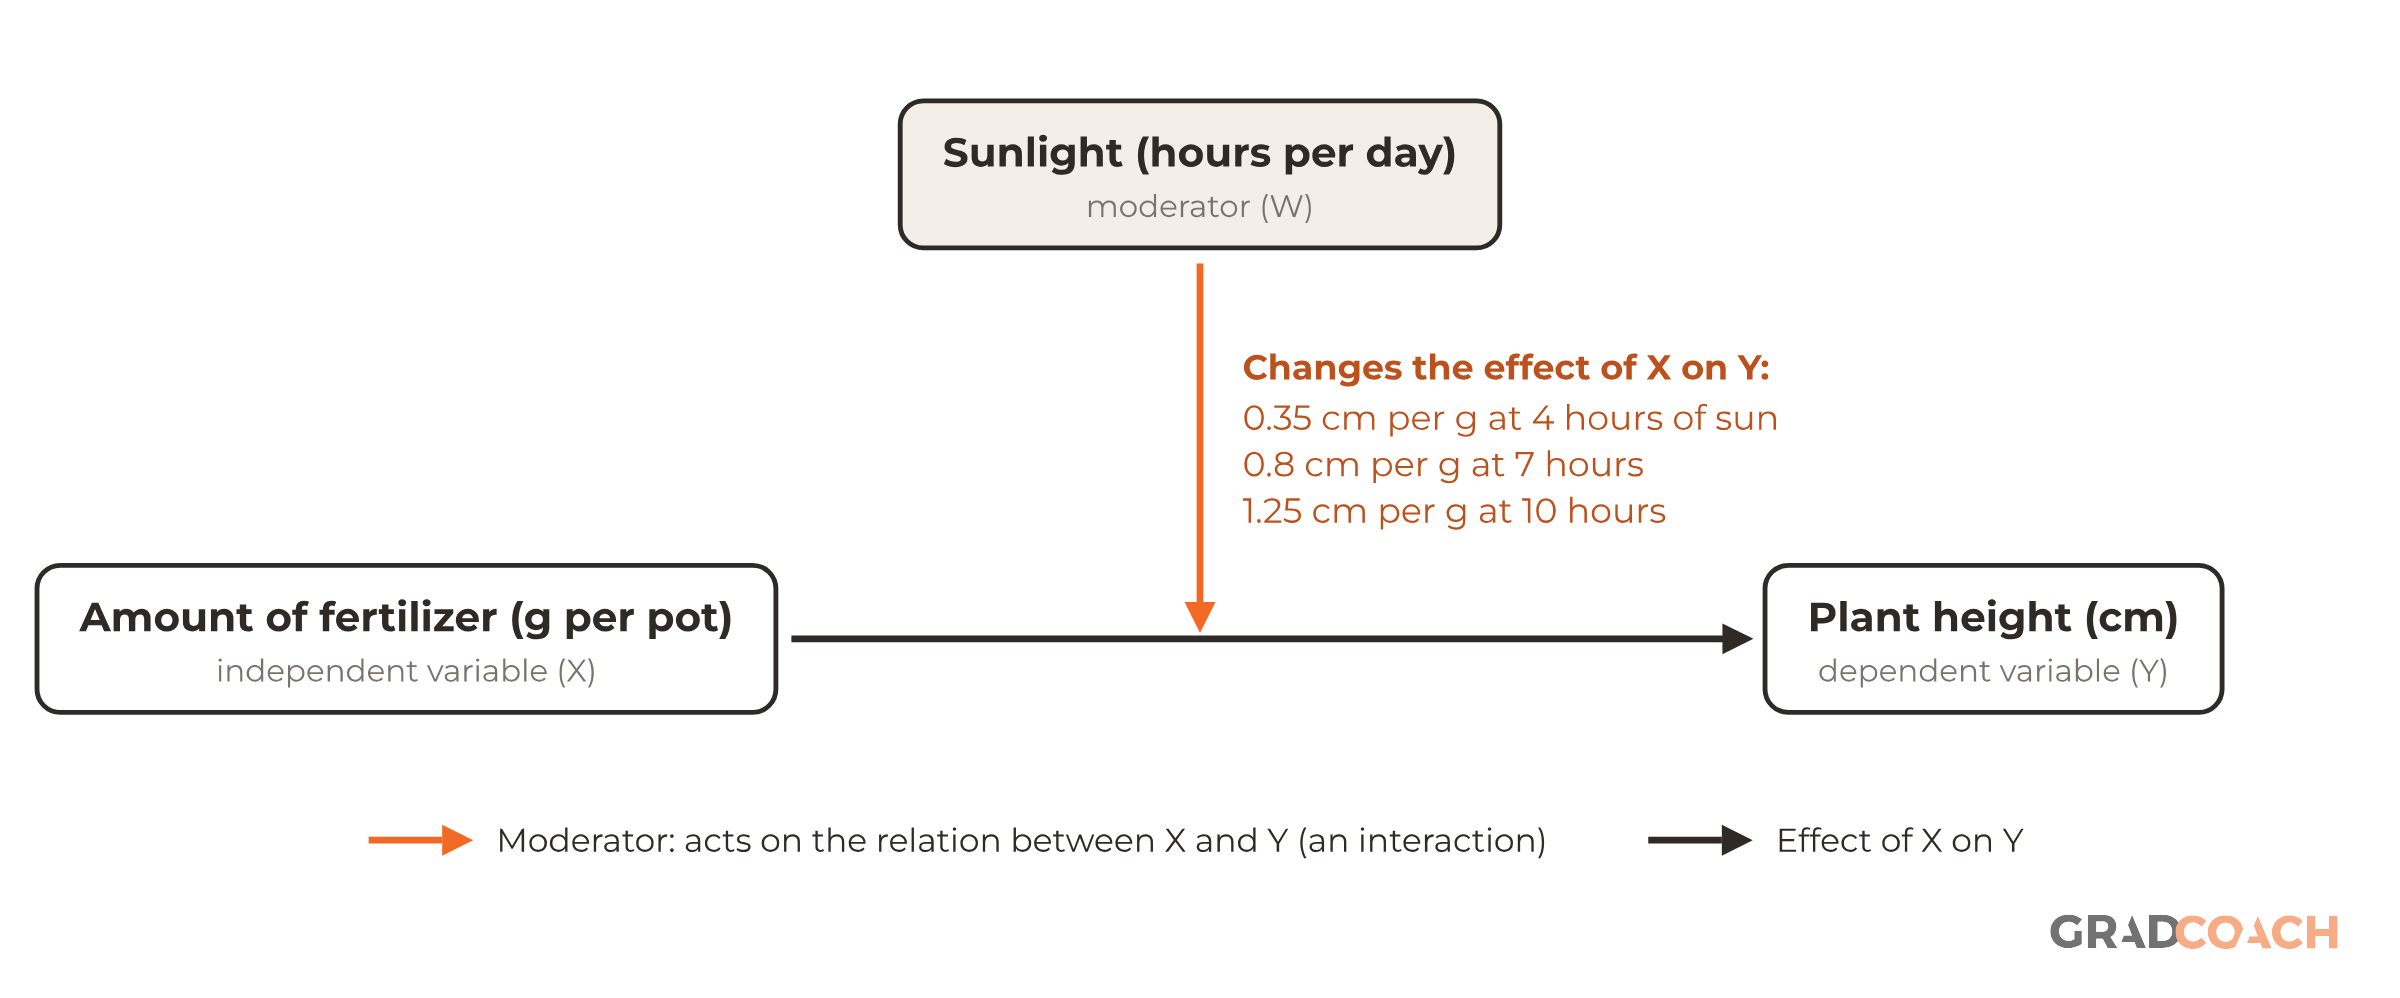
A moderator doesn’t have to be a category. Go back to the fertilizer experiment, where sunlight was held constant. Now let sunlight vary. In this illustrative model, each gram of fertilizer adds 0.35 cm of height at 4 hours of sun a day, 0.8 cm at 7 hours and 1.25 cm at 10 hours. The fertilizer still helps every time, but how much it helps depends on the sunlight, so sunlight is a moderator.

Sunlight was a control in the first experiment and a moderator here, so as you plan your controls, ask of each one whether the effect might depend on it.
In our experience, moderators are popular in dissertations because “X affects Y, but only for some people” is often a new finding. They’re also harder to find than students expect. The psychology doctorate below, from Bamberg, reviewed the research on whether personality traits and cognitive ability moderate anchoring (the pull of a number you’ve just seen on your next estimate), and its summary doesn’t mince words:
Two lessons sit in those two sentences.
The first is that a moderator you expected may not show up, and that’s still a finding worth reporting.
The second is that a moderator test is only as good as your measures: if they aren’t reliable, a real moderator can stay hidden. Interaction effects (the statistical name for a moderator’s effect) are also often small, so if you plan to test one, check your sample size first.
What is a mediating variable?
A mediating variable sits between the independent and dependent variable and explains how one affects the other. The independent variable changes the mediator, and the mediator in turn changes the outcome. Baron and Kenny draw the line between a mediator and a moderator in a single sentence:
Back in the fertilizer experiment, why does fertilizer make plants taller? Partly because it raises the nitrogen in the soil, and nitrogen helps the plant grow. Soil nitrogen is the mediator.
In this illustrative model, each gram of fertilizer raises soil nitrogen by 4 mg/kg (path a), and each mg/kg of nitrogen adds 0.15 cm of height with fertilizer held constant (path b). Multiply the two and you get the indirect effect: 4 × 0.15 = 0.6 cm per gram. The remaining 0.2 cm per gram is the direct effect (c′), which doesn’t run through nitrogen, and the two add up to the total effect of 0.8 cm per gram (c).

The key test for a mediator is that it’s caused by the independent variable and then affects the outcome. A third variable that influences both the independent and the dependent variable from outside isn’t a mediator; it’s a confounder, which comes next. In a dissertation, a mediation question usually names the mediator outright. This one comes from an education doctorate on English language learners:
Here, English language proficiency is the independent variable, academic achievement is the dependent variable and academic growth is the proposed mediator. The phrase “to what extent” matters: it leaves room for growth to explain part of the relationship rather than all of it, just as nitrogen explains 0.6 of the 0.8 cm in the plant example. If you’re proposing a mediator, I’d spell out why the independent variable should change it, and phrase your question so that partial mediation is a possible answer.
What is a confounding variable?
A confounding variable (also called a lurking variable) is a factor outside your main relationship that can distort it. A review of confounding in clinical research describes it as “a ‘mixing of effects’”: the effect of your independent variable gets mixed up with the effect of something else. For a variable to confound a relationship, it needs to:
- Be associated with the independent variable
- Be related to the dependent variable in its own right, not just through the independent variable
- Not be caused by the independent variable or by the outcome (if the independent variable causes it, it’s a mediator, as you saw above)
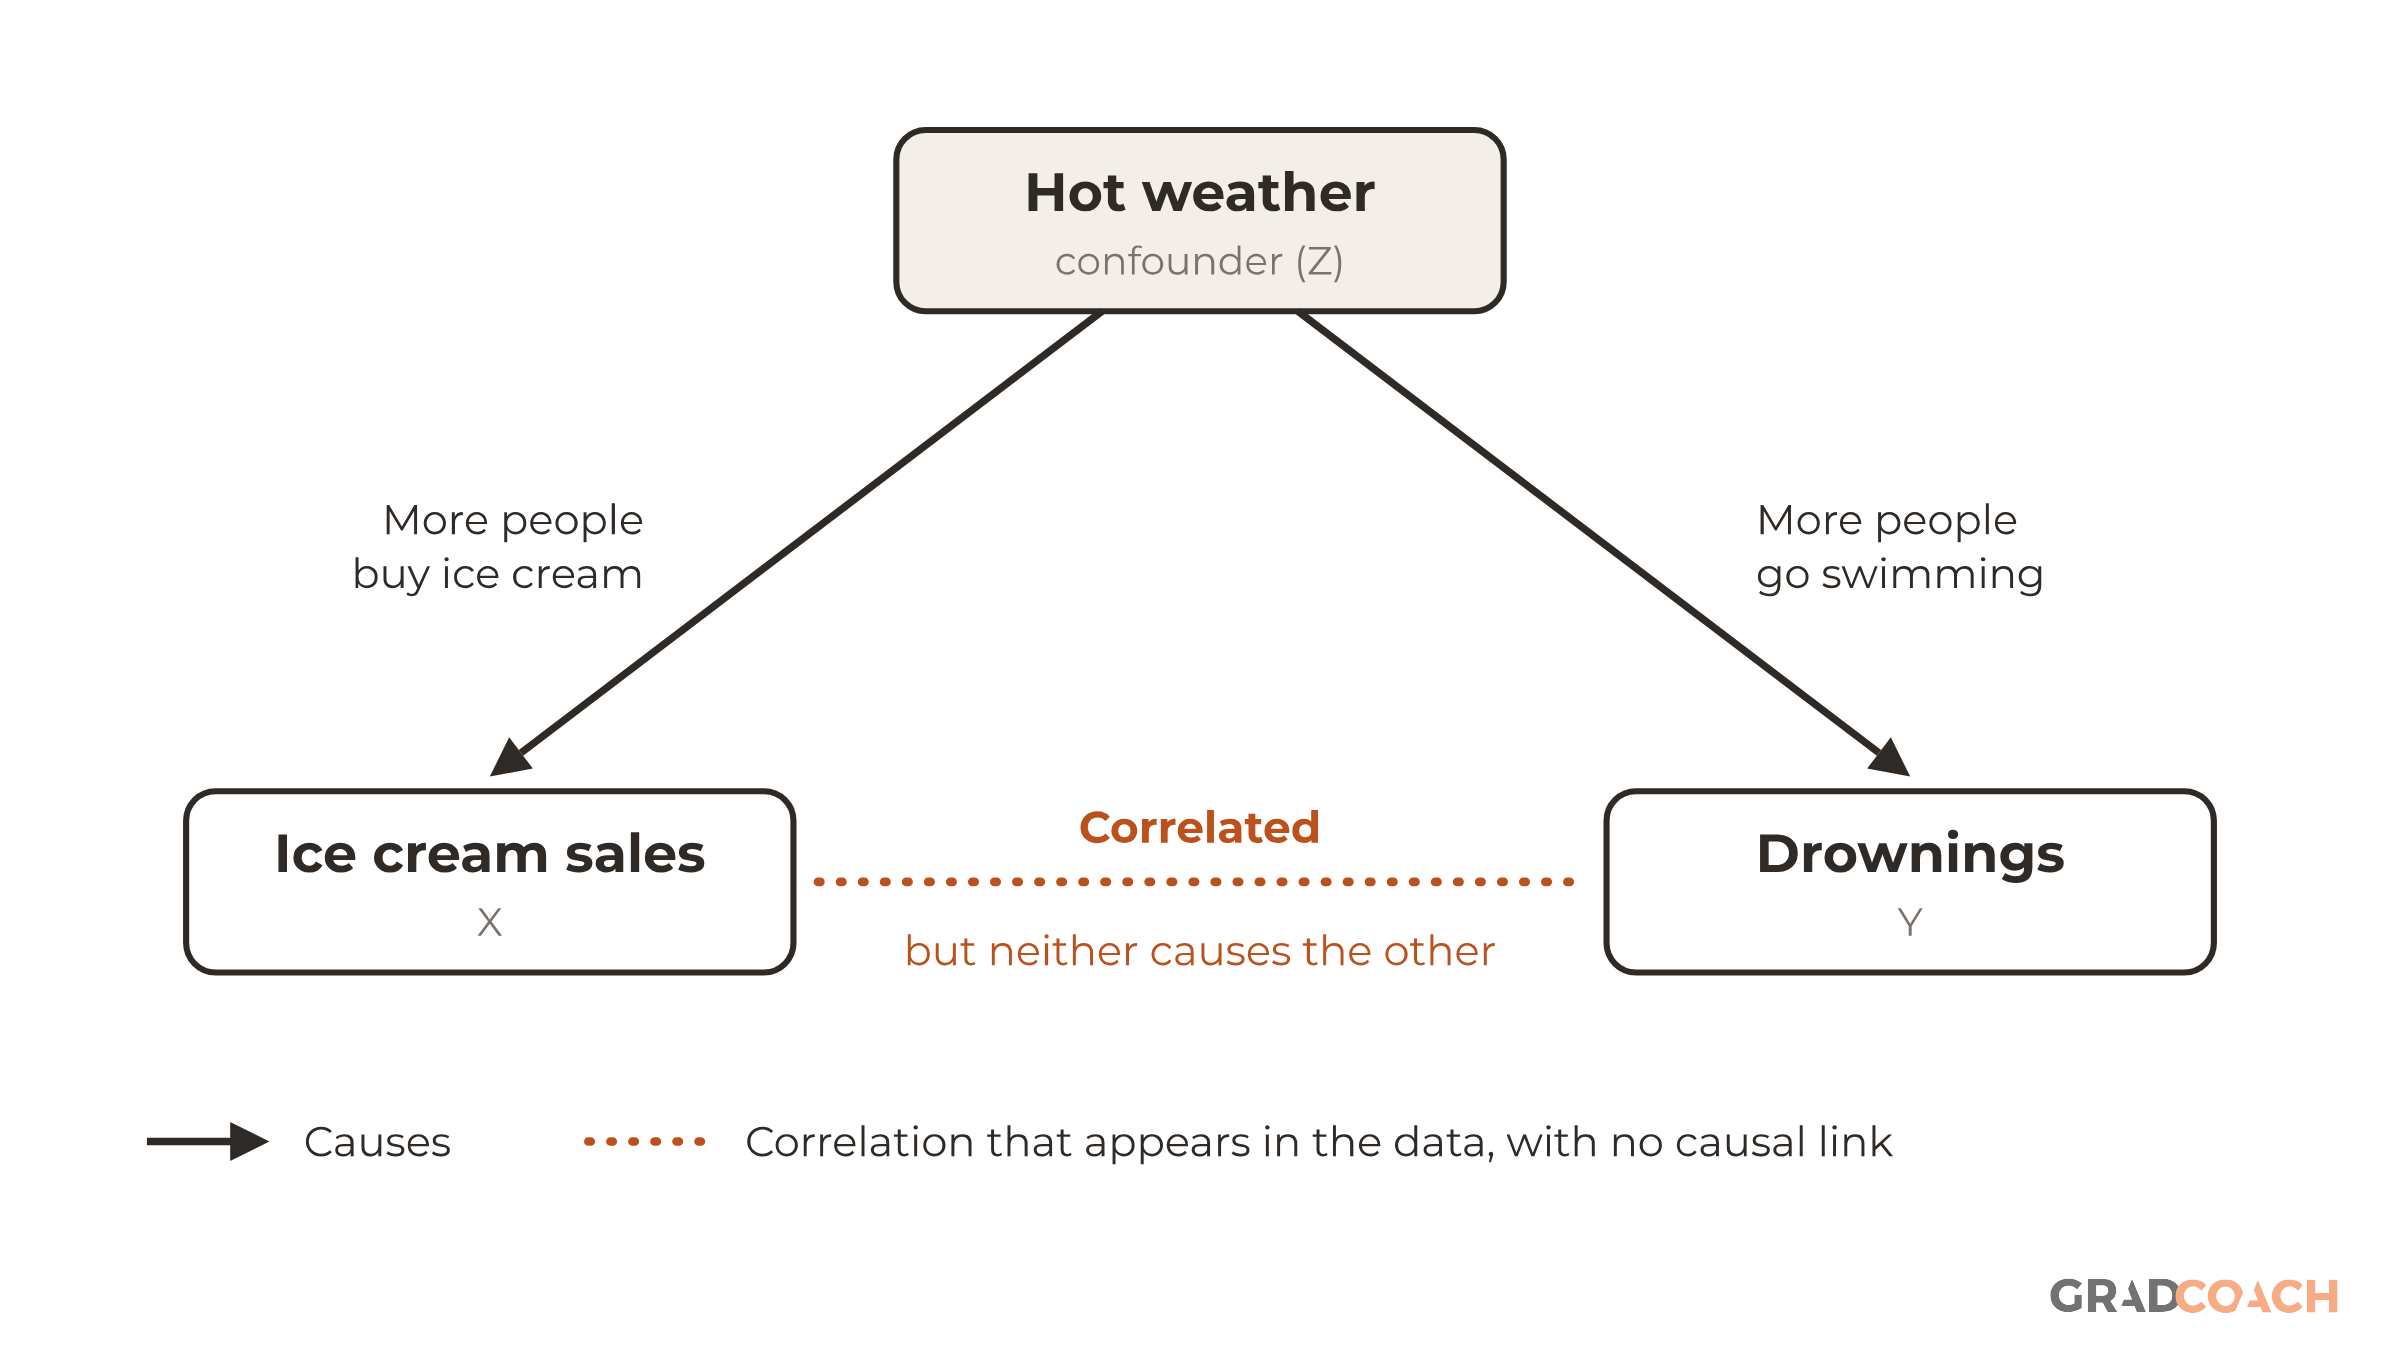
The classic example is ice cream and drownings. Both rise together, but ice cream doesn’t make anyone drown. Hot weather drives both: more people buy ice cream, and more people go swimming.

Confounders show up in real research all the time, often in places that look obvious once someone points them out. Advertising is a good case. Here’s how a resource economics PhD from UMass Amherst sets out the problem:
The logic is the same as the ice cream case. Whatever makes sales likely to be high (a holiday season, say) also makes firms spend more on advertising, so a simple comparison would credit the ads with sales they didn’t cause. The fix it describes, running experiments, works because randomly assigning the independent variable stops the confounder from lining up with it.
If you can’t randomize, the next best step is to measure your likely confounders and adjust for them. The review’s summary is blunt: “Study design must include the measurement and reporting of such factors.” In most dissertations, that means demographics such as age, gender, ethnicity, socioeconomic status, education and health status, plus environmental factors such as air pollution in a study of health outcomes. List the confounders you can think of before you collect data, because you can’t adjust for a variable you never measured.
What is a latent variable?
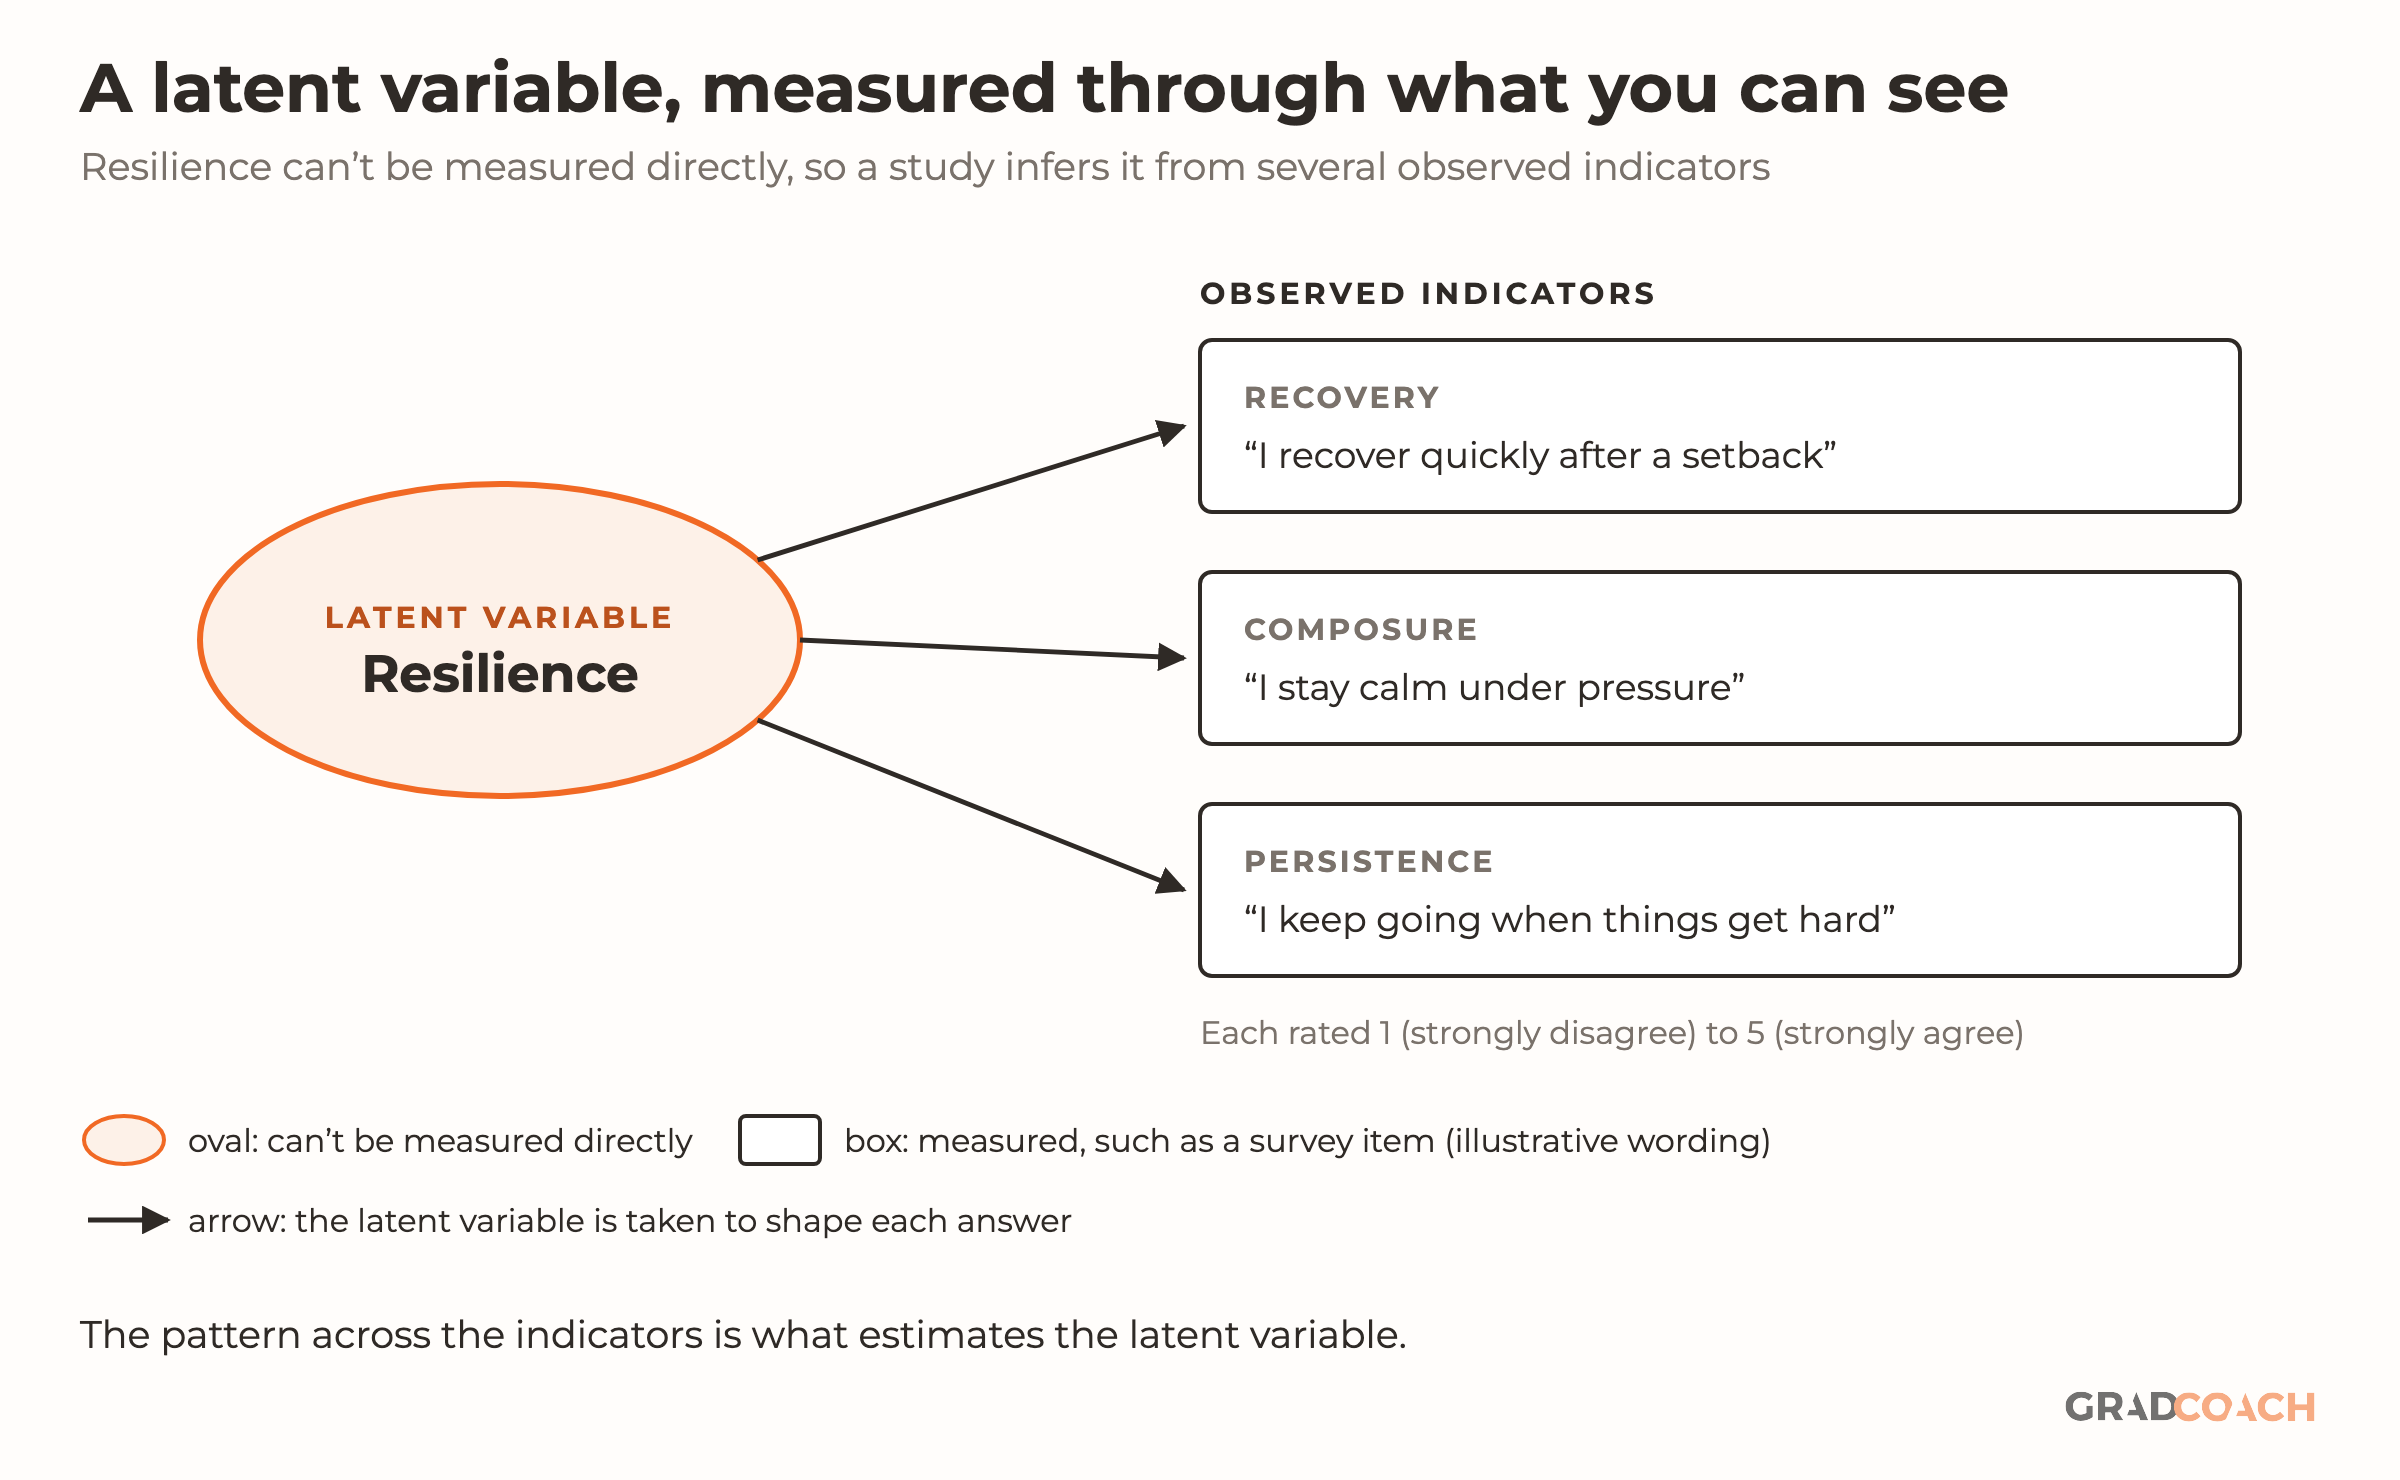
A latent variable is one you can’t observe or measure directly. The APA Dictionary of Psychology defines it as “a theoretical entity or construct that is used to explain one or more manifest variables”, where manifest variables are the ones you can measure. Latent variables are also called hidden or underlying variables, and they’re everywhere in the social sciences.
The same applies to many concepts researchers care about, for example:
- Emotional intelligence
- Quality of life
- Business confidence
- Ease of use
- Fitness
In practice, you measure a latent variable through several observed indicators, usually survey items, each of which captures part of it. The APA’s example is conscientiousness, inferred from items about behaviors such as attending classes consistently and handing in assignments on time. The patterns across those items are then analyzed, typically with factor analysis or structural equation modeling, to estimate the latent variable. Here’s how that works for resilience, the example from earlier:

If your study has a latent variable, report how reliable its indicators are as a set (usually with Cronbach’s alpha or McDonald’s omega), because the estimate is only as good as the items behind it.
Variable mix-ups to avoid
In our coaching sessions, the same few mix-ups keep coming back. Here are the ones worth checking your draft for:
- Calling the outcome the independent variable. If you measure it at the end to see whether it changed, it’s your dependent variable, however the studies you’re building on label it.
- Swapping moderators and mediators. A moderator changes how strongly X affects Y; a mediator is changed by X and then changes Y. If you can’t say how X would change your third variable, it isn’t a mediator.
- Treating demographics as background noise. Age, gender and income are control variables in one study and moderators in another. Decide which job each one does, and say so.
Most of these are fixed by one habit: before you write your hypotheses, draw your model as boxes and arrows, with every variable in it. If you can’t place a variable on the diagram, you haven’t yet decided what it does in your study.
Still have questions?
What is the difference between a mediator and a moderator?
A mediator explains how or why one variable affects another, while a moderator changes when or for whom the effect holds, or how strong it is. Baron and Kenny’s 1986 paper on the distinction puts it in one line: “Whereas moderator variables specify when certain effects will hold, mediators speak to how or why such effects occur.” For example, if fertilizer makes plants taller by raising soil nitrogen, nitrogen is a mediator; if fertilizer works better in sunnier spots, sunlight is a moderator.
Can a variable be both independent and dependent?
Yes. A variable’s role comes from the research question, not from the variable itself, so stress could be the independent variable in a study of stress and sleep and the dependent variable in a study of workload and stress. Within one model, a mediator plays both roles at once: it’s the outcome of the independent variable and a cause of the dependent variable.
Can a study have more than one independent variable?
Yes, and many dissertations do. A business PhD from Lincoln International Business School on consumers’ intention to use collection-and-delivery points tested nine independent variables against one dependent variable, adoption intention. A study can also have more than one dependent variable. Each extra variable needs its own justification and, for a quantitative study, a large enough sample to test it.
Is age an independent or dependent variable?
Age is usually an independent variable, because nothing in a typical study can change a participant’s age. Because you can’t assign it, though, a study using age can show that it’s related to an outcome, not that it causes it. Age is also often used as a control variable, when a study wants to rule it out rather than test it.
What is an extraneous variable?
An extraneous variable is any variable you aren’t studying that could still affect your dependent variable. The APA Dictionary of Psychology defines it as “a measure that is not under investigation in an experiment but may potentially affect the outcome or dependent variable”. Researchers deal with extraneous variables by controlling them, and an extraneous variable that also varies with the independent variable becomes a confounder.
Do qualitative studies have independent variables?
Usually not in the formal sense. Qualitative research typically explores how people experience or make sense of something, rather than testing whether one variable changes another, so its questions aren’t usually framed as independent and dependent variables. Some qualitative studies compare groups, such as new and experienced teachers, but they describe those differences in words rather than test them statistically.
Can’t find your answer here? Ask a Grad Coach directly – the initial chat is free.
Speak with a friendly coach →


Cite-worthy sources
Cite this article
Jansen, D. (2023). Research Variables 101: Independent, Dependent & More. Grad Coach. https://gradcoach.com/indepedent-dependent-variables/
- American Psychological Association. (2018). Extraneous variable. In APA dictionary of psychology.
- American Psychological Association. (2018). Latent variable. In APA dictionary of psychology.
- Baron, R. M., & Kenny, D. A. (1986). The moderator–mediator variable distinction in social psychological research: Conceptual, strategic, and statistical considerations. Journal of Personality and Social Psychology, 51(6), 1173-1182.
- Cengiz, E. (2022). Essays on advertising, sodium intake, and soda taxes [Doctoral dissertation, University of Massachusetts Amherst].
- Feuerbach, M. R. (2016). A quantitative study of the perceived leadership practices of business and educational leaders in North Georgia [Doctoral dissertation, Valdosta State University].
- Green, R. T. (2022). An examination of student achievement in a South Georgia 21st Century Community Learning Center [Doctoral dissertation, Valdosta State University].
- Kadoma, K. (2026). Beyond fairness metrics: Human experiences and differential outcomes in AI-mediated work settings [Doctoral dissertation, Cornell University].
- Kou, B. (2026). Understanding and mitigating hallucination of language models in software engineering [Doctoral dissertation, Purdue University].
- Loughridge, C. A. (2022). Quantitative study of predictive relationships between English language proficiency, academic growth, and academic achievement assessments in North Georgia [Doctoral dissertation, Valdosta State University].
- Luong, V. D. (2025). Factors influencing e-commerce consumer’s adoption intention towards collection-and-delivery points (CDPs): The case of Vietnam [Doctoral thesis, Lincoln International Business School].
- Röseler, L. (2021). Anchoring effects: Resolving the contradictions of personality moderator research [Doctoral dissertation, University of Bamberg].
- Skelly, A. C., Dettori, J. R., & Brodt, E. D. (2012). Assessing bias: The importance of considering confounding. Evidence-Based Spine-Care Journal, 3(1), 9-12.
- Walters, S. D. (2020). A quantitative analysis of Board of Certification examination outcomes for athletic training programs [Doctoral dissertation, Valdosta State University].
- Wright, L. B. (2019). Library instruction’s relationship to student success [Doctoral dissertation, Valdosta State University].
Found this helpful?
Keep us near the top of your Google results.