Sampling Methods & Strategies 101
A plain-language guide to eight popular methods, with real examples


The 30-second summary
Sampling is how you choose who to study from the group you want to draw conclusions about, and your method decides what your findings can claim.
- Probability sampling (simple random, stratified, cluster, systematic) gives everyone a known chance, so you can generalize statistically.
- Non-probability sampling (purposive, convenience, snowball, quota) chooses by judgment, access or referral, trading statistical reach for access or depth.
- Stratified sampling draws from every subgroup; cluster sampling picks a few whole groups at random and studies those.
- Sample size follows from the method: a power analysis for statistical tests, a saturation argument for interviews.
- Your research questions decide the family: asking how common something is needs a probability sample; asking about experience usually doesn’t.
Writing yours up? Our free methodology chapter template gives your sampling strategy its own section, with space to justify each choice.
Navigate
A sampling section is often a single paragraph, and it carries far more weight than its length suggests. It says who your findings can speak for, so if the sampling method doesn’t fit your research questions, or the paragraph is too vague to check, every result after it inherits the doubt, however careful your analysis was.
In our work with 10,000+ students, we’ve seen plenty of solid studies let down by a sampling section of three vague lines. In this post, I’ll explain the eight sampling methods you’re most likely to need, draw each of them on the same population and walk through four real dissertations that describe theirs well. Then I’ll show you how many people you need and how to defend your choice.
What is sampling?
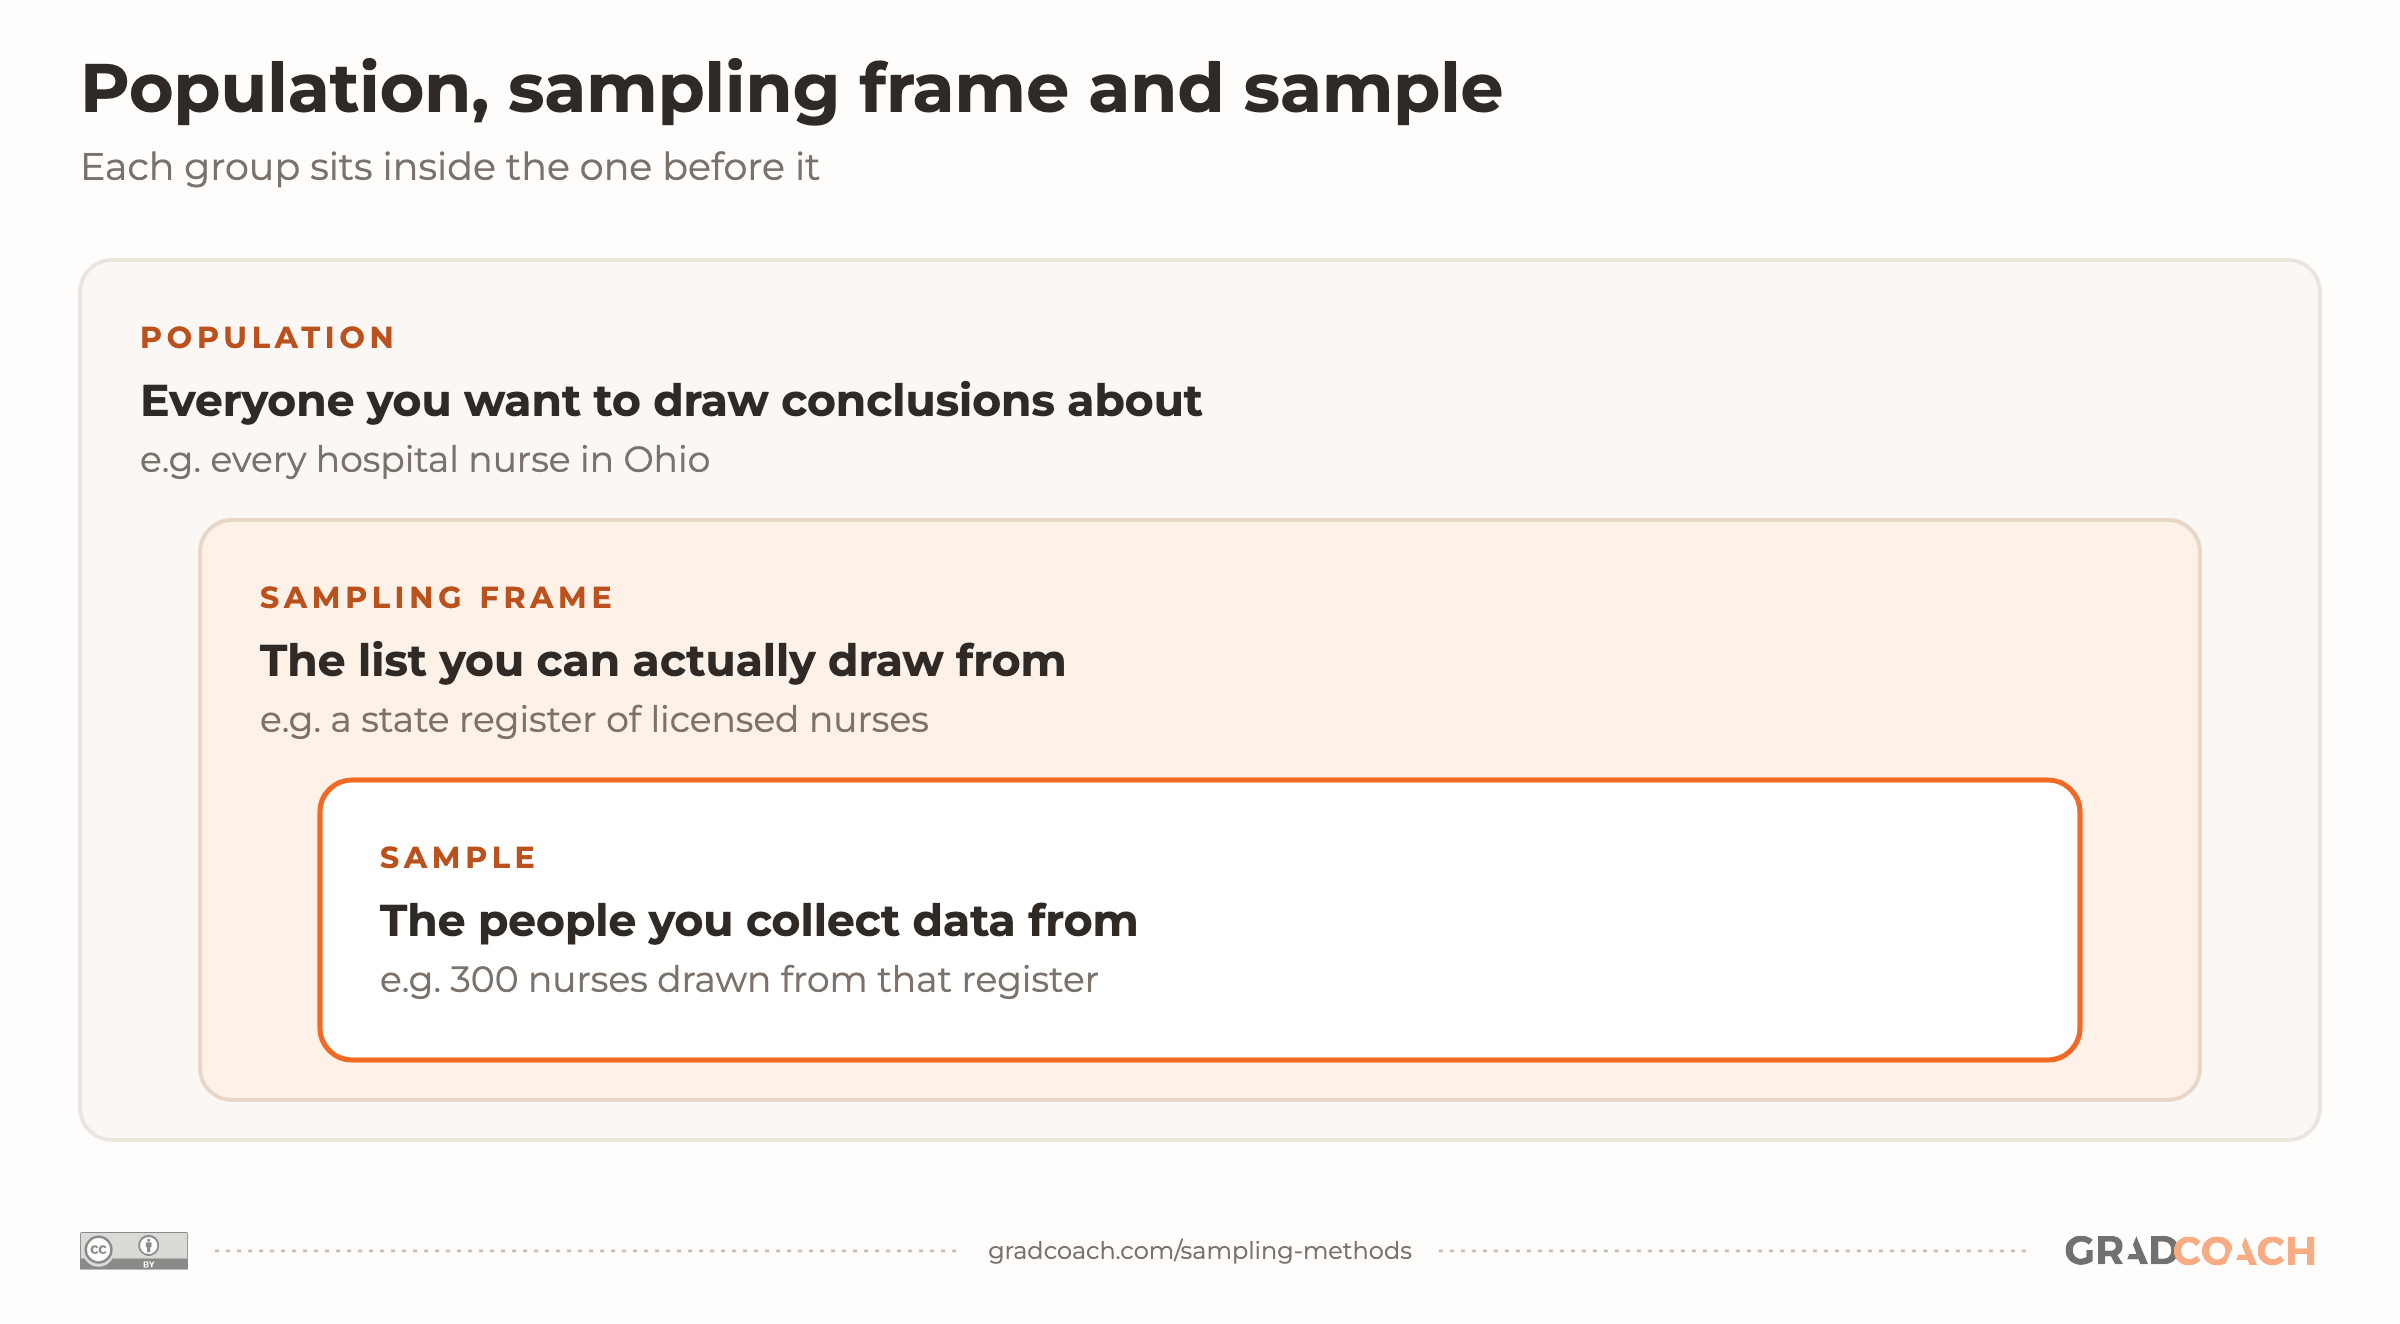
In research, sampling is the process of selecting a smaller group to collect data from, out of the larger group you want to draw conclusions about. That larger group is your population: every hospital nurse in Ohio, say, or every first-year student at your university. The smaller group you actually survey or interview is your sample.
Your sampling strategy is one of the core decisions in your research methodology, and you need one because you usually can’t reach everyone. If your study asked how hospital nurses in Ohio cope with night shifts, you couldn’t interview all of them (good luck with that), but you could survey a few hundred.
Between your population and your sample sits a third idea: the sampling frame, the actual list you draw your sample from. A staff register, a student enrollment list or a membership database can all be frames. Ideally the frame covers your whole population and nobody else, but in practice it rarely matches perfectly, and the gap between the two is worth a sentence in your methodology chapter.

If your sample were a perfect miniature of your population, you could generalize your findings to everyone in it. In the real world, though, no sample is ever perfect, and not every study needs to generalize. Whether yours does depends on your research aims, which is why the method matters more than the sample’s size alone.
Probability vs non-probability sampling
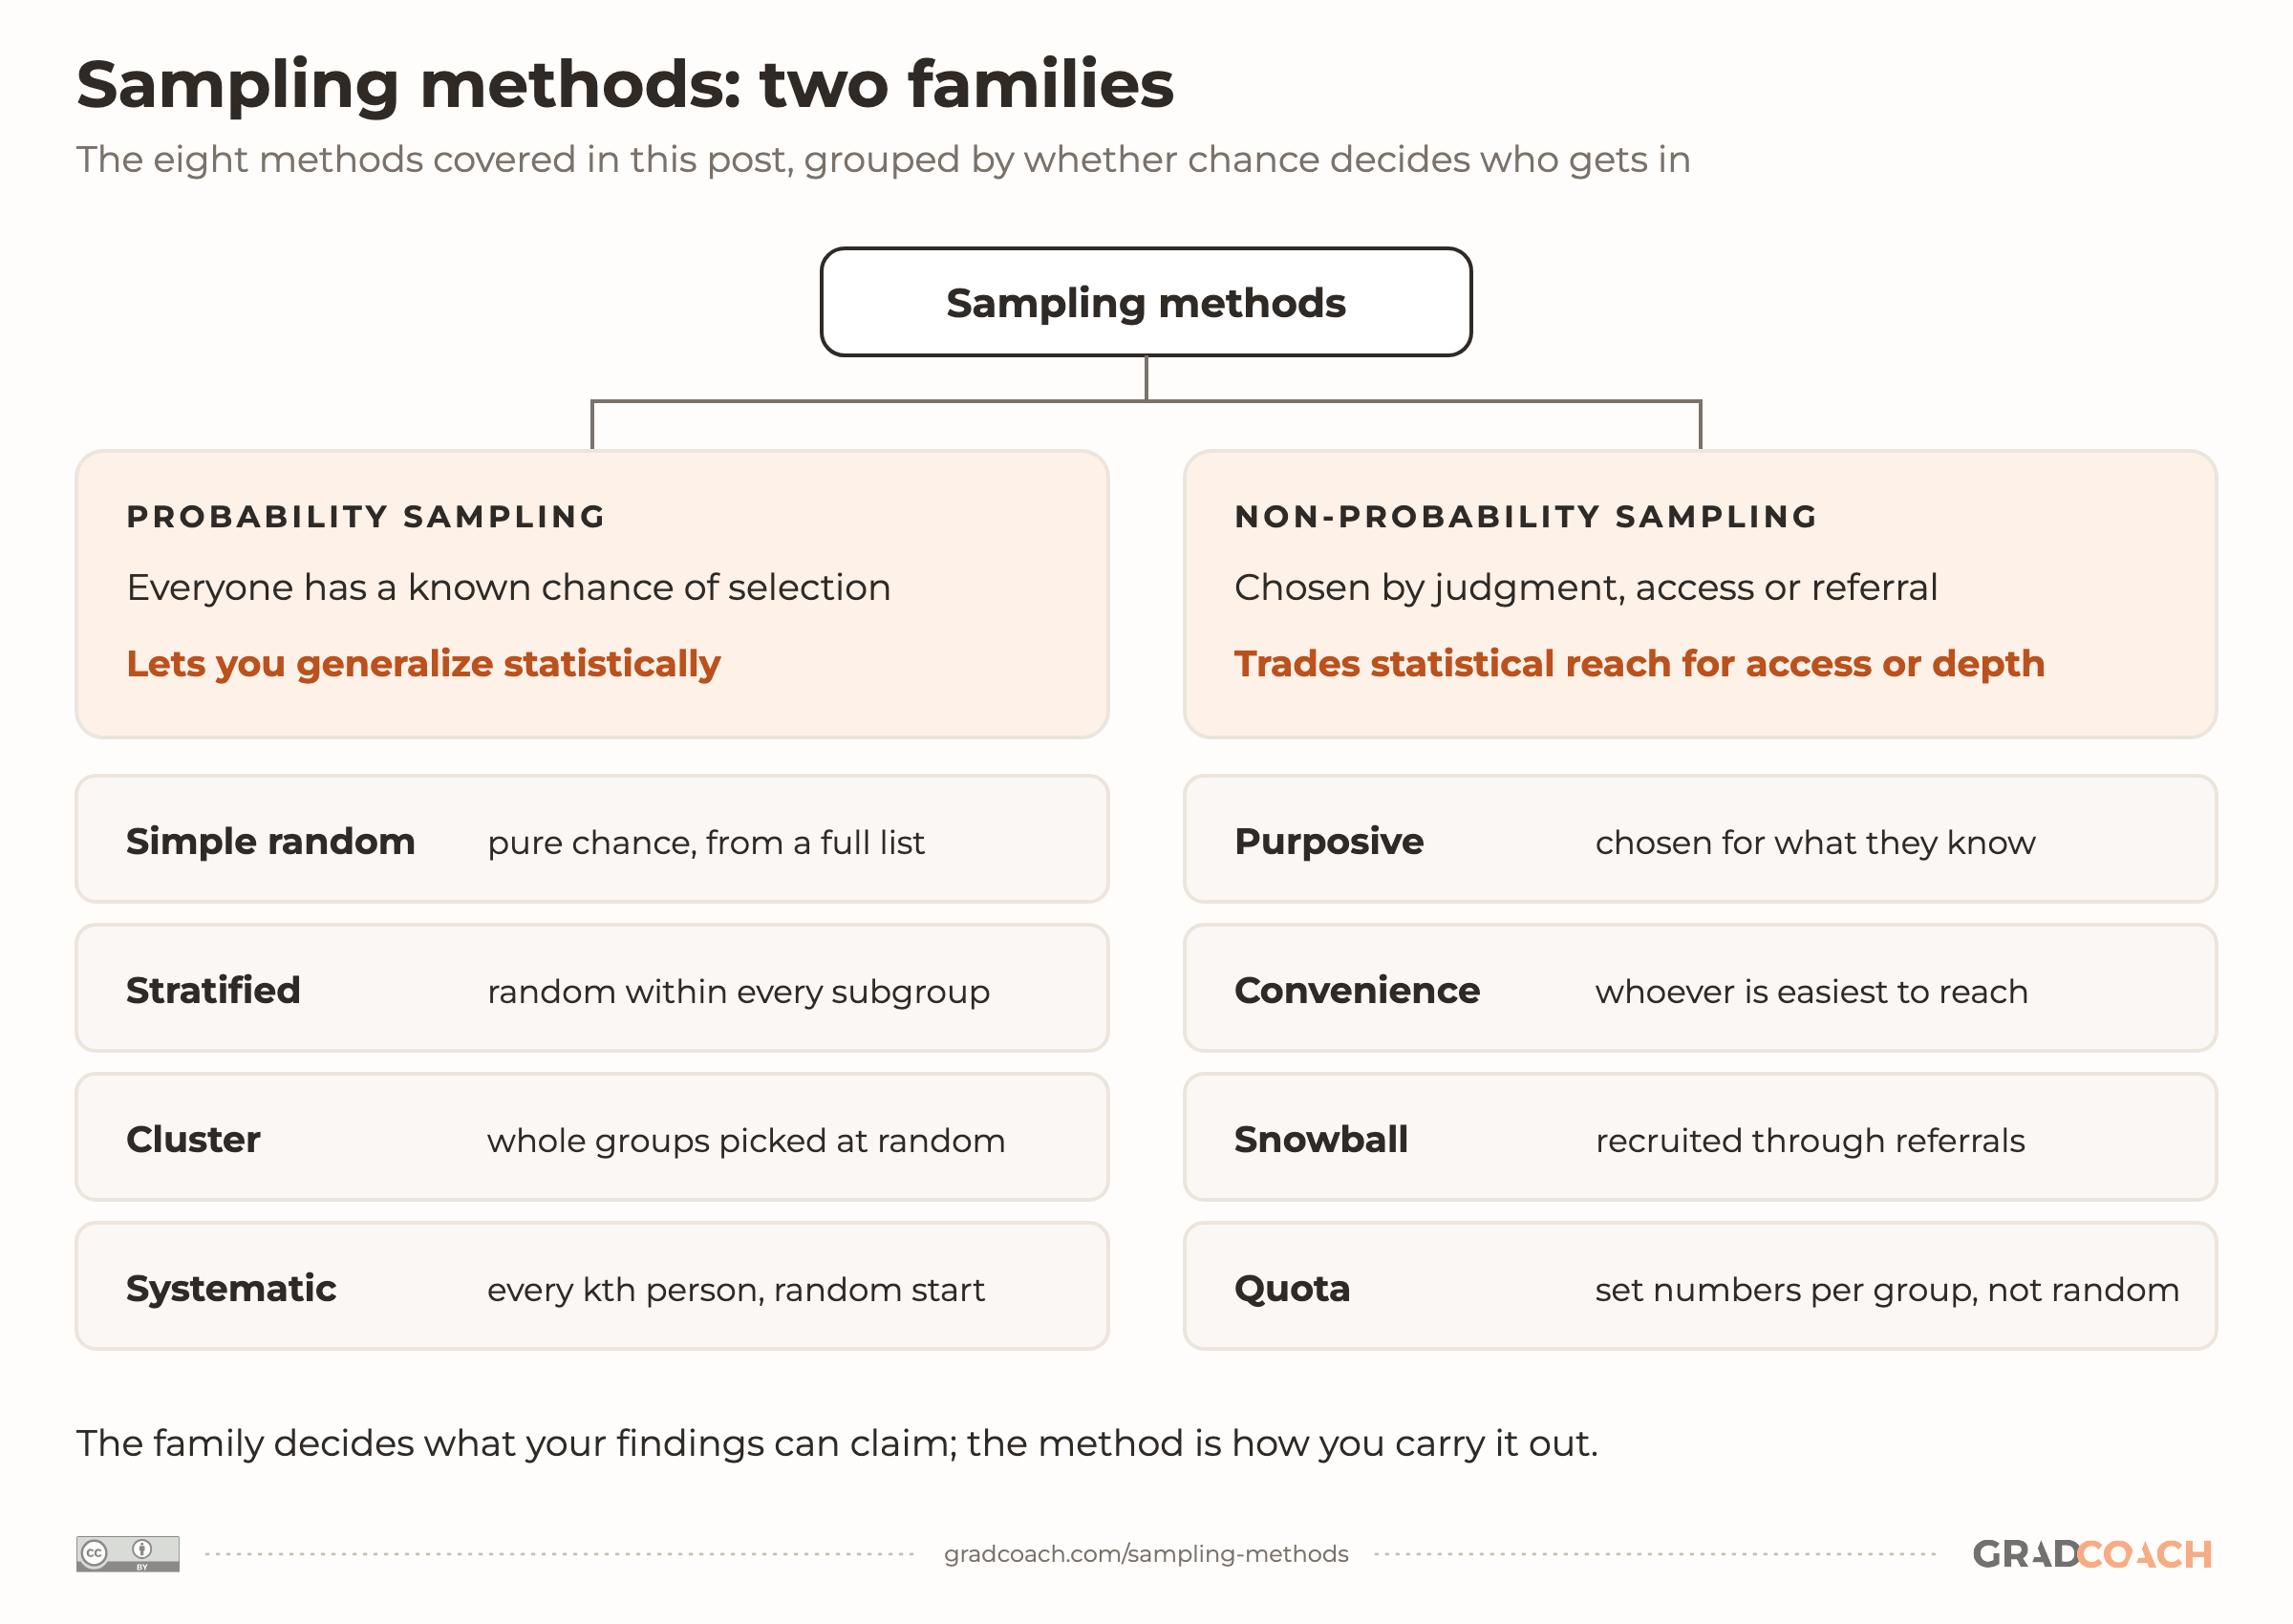
Every sampling method belongs to one of two families, and the family matters more than the individual method, because it decides whether you can generalize statistically. In other words, it decides whether you can use what you found in your sample to estimate your population’s figures, with a known margin of error.
Probability sampling (also called random sampling) means everyone in the population has a known, non-zero chance of being selected, and chance decides who gets in. Because selection follows a set procedure, you can use inferential statistics (methods that generalize from a sample to its population) to estimate how far your sample’s results are likely to sit from the population’s. That’s why probability methods are the usual choice in quantitative research that aims to describe or test a whole population.
Non-probability sampling means selection depends on your judgment, on who you can reach or on who refers whom, so some people have no chance of being included. You can’t attach a conventional margin of error (the plus-or-minus range around a survey figure) to the result, but you can choose people for what they know. So these methods dominate qualitative research, where the depth of each account matters more than statistical reach.
Here’s which family each of the eight methods belongs to:

“So, is non-probability sampling the weaker choice?”
Only if your research questions need what it can’t give. For example, a study of how six school principals handled a merger doesn’t need a random sample of principals; it needs the right six. What it can’t do is claim that its findings hold for principals in general, and saying so plainly is part of using the method well.
Probability-based sampling methods
Here are the four probability methods you’ll meet most often in dissertations and theses:
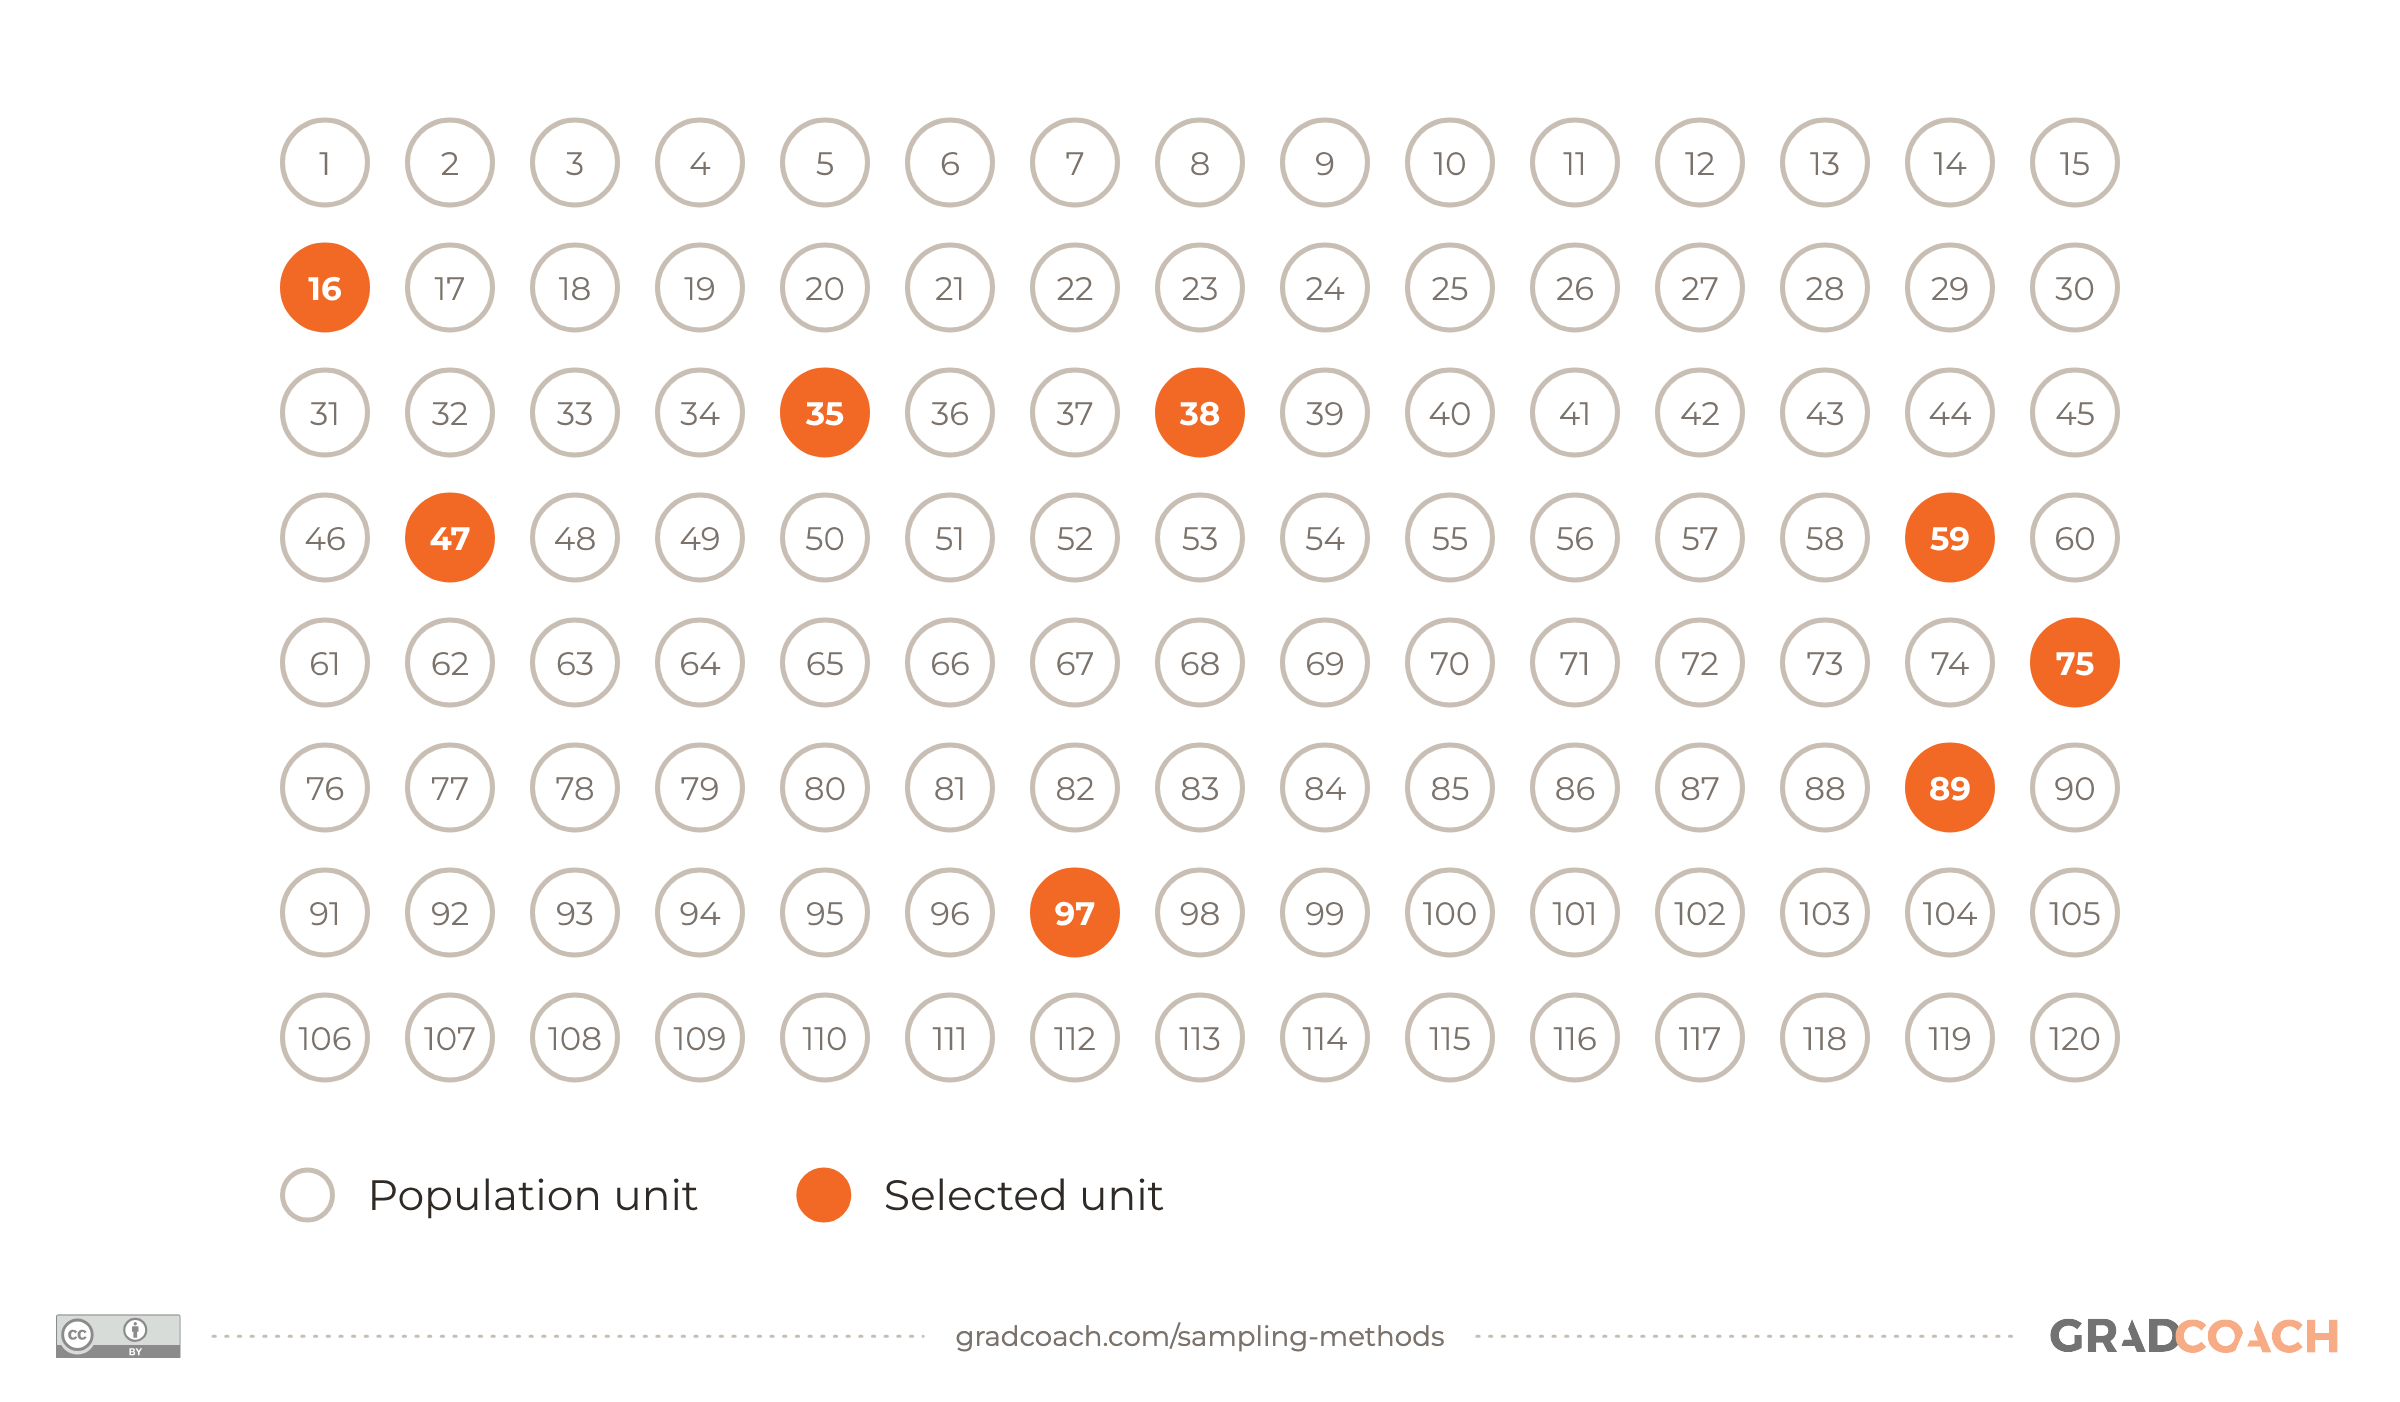
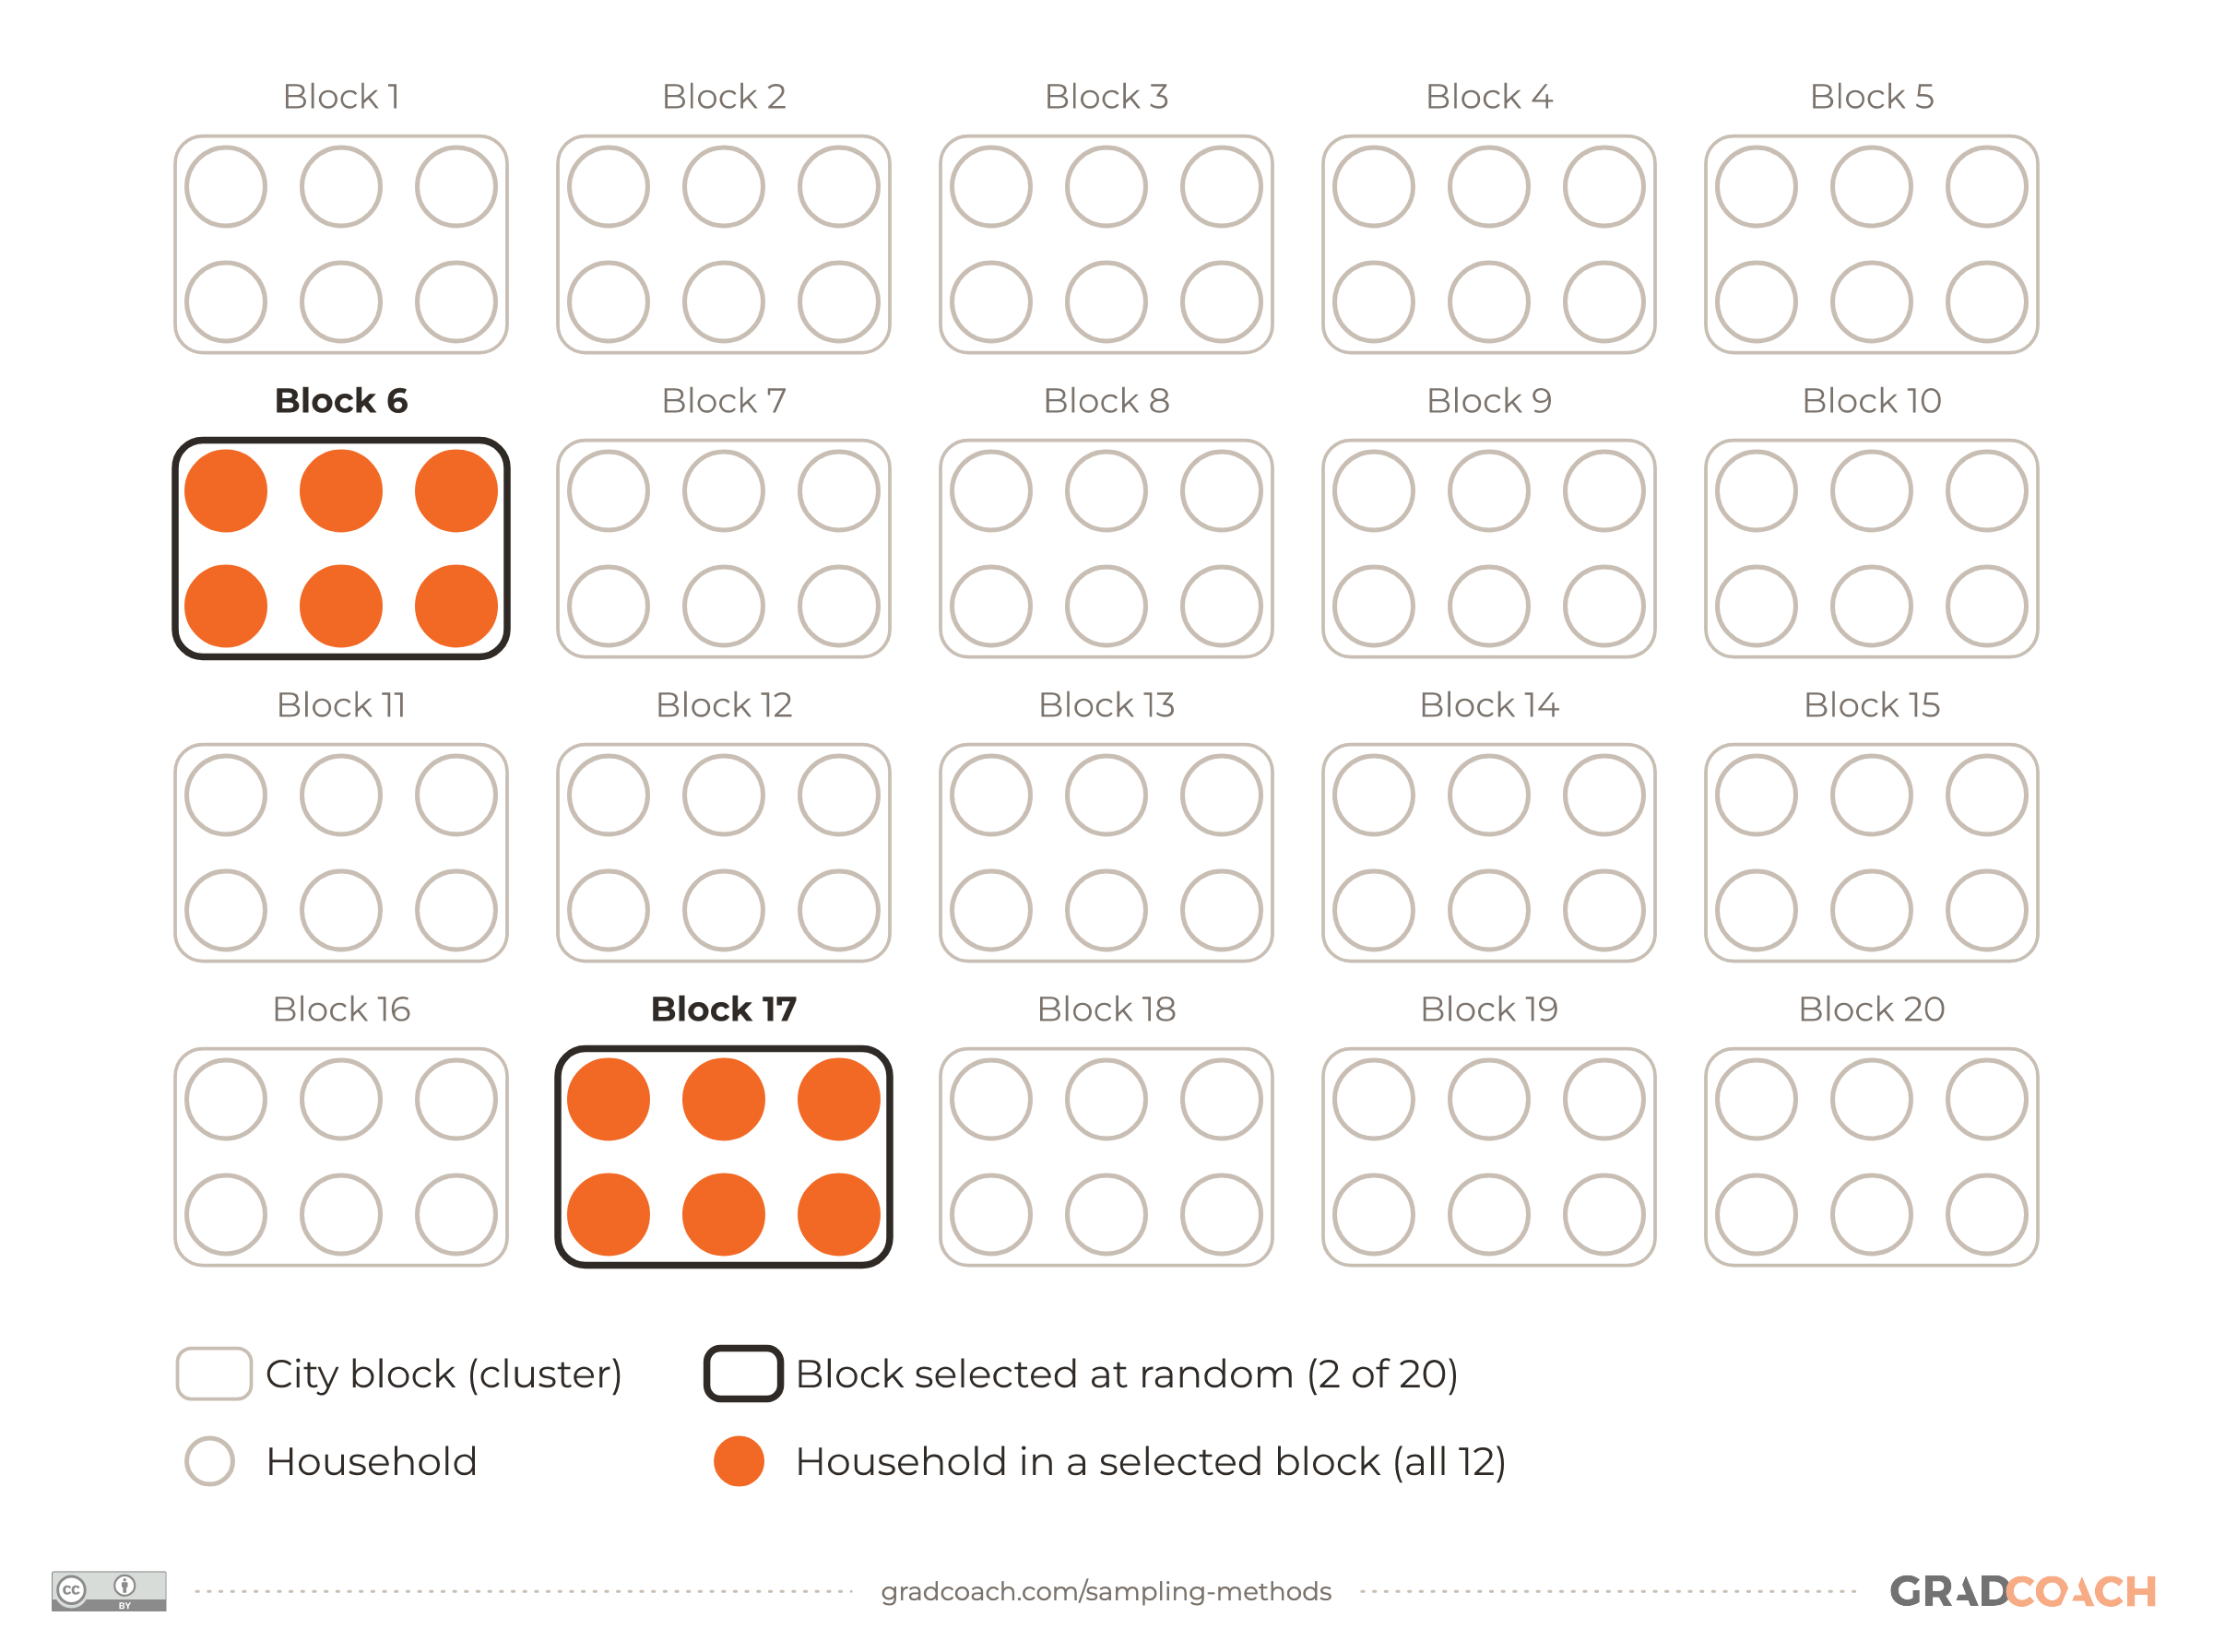
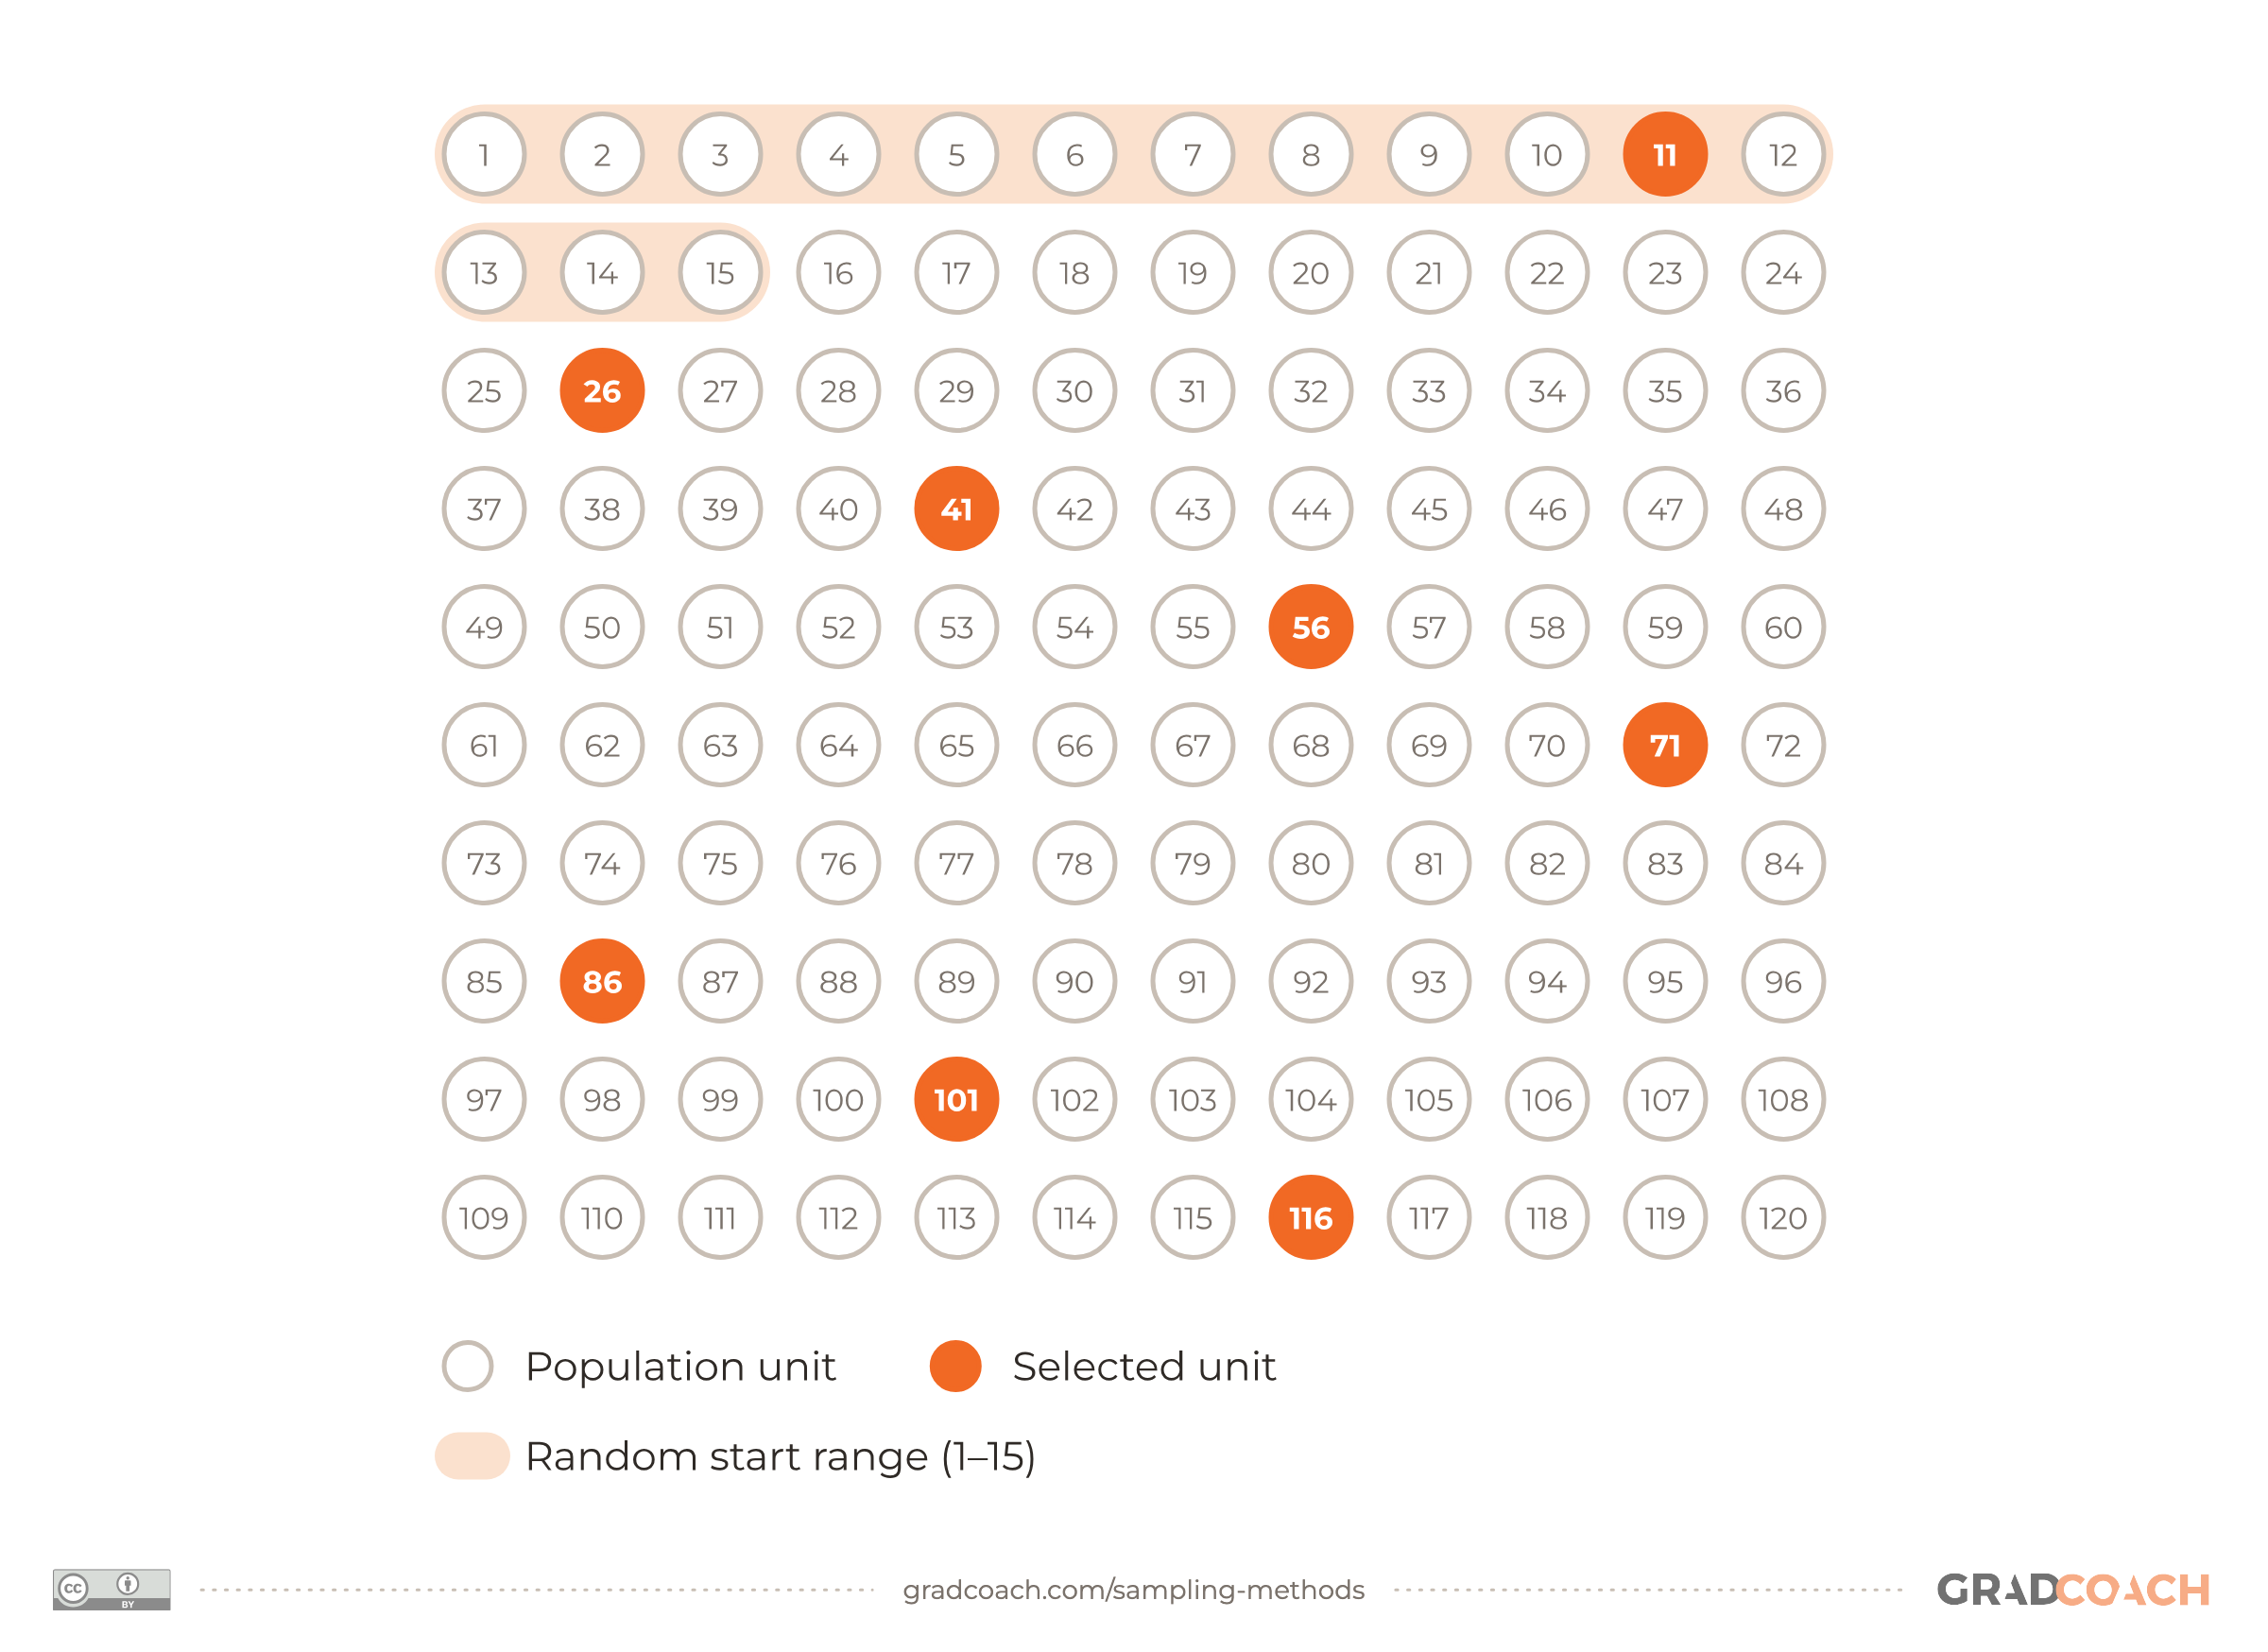
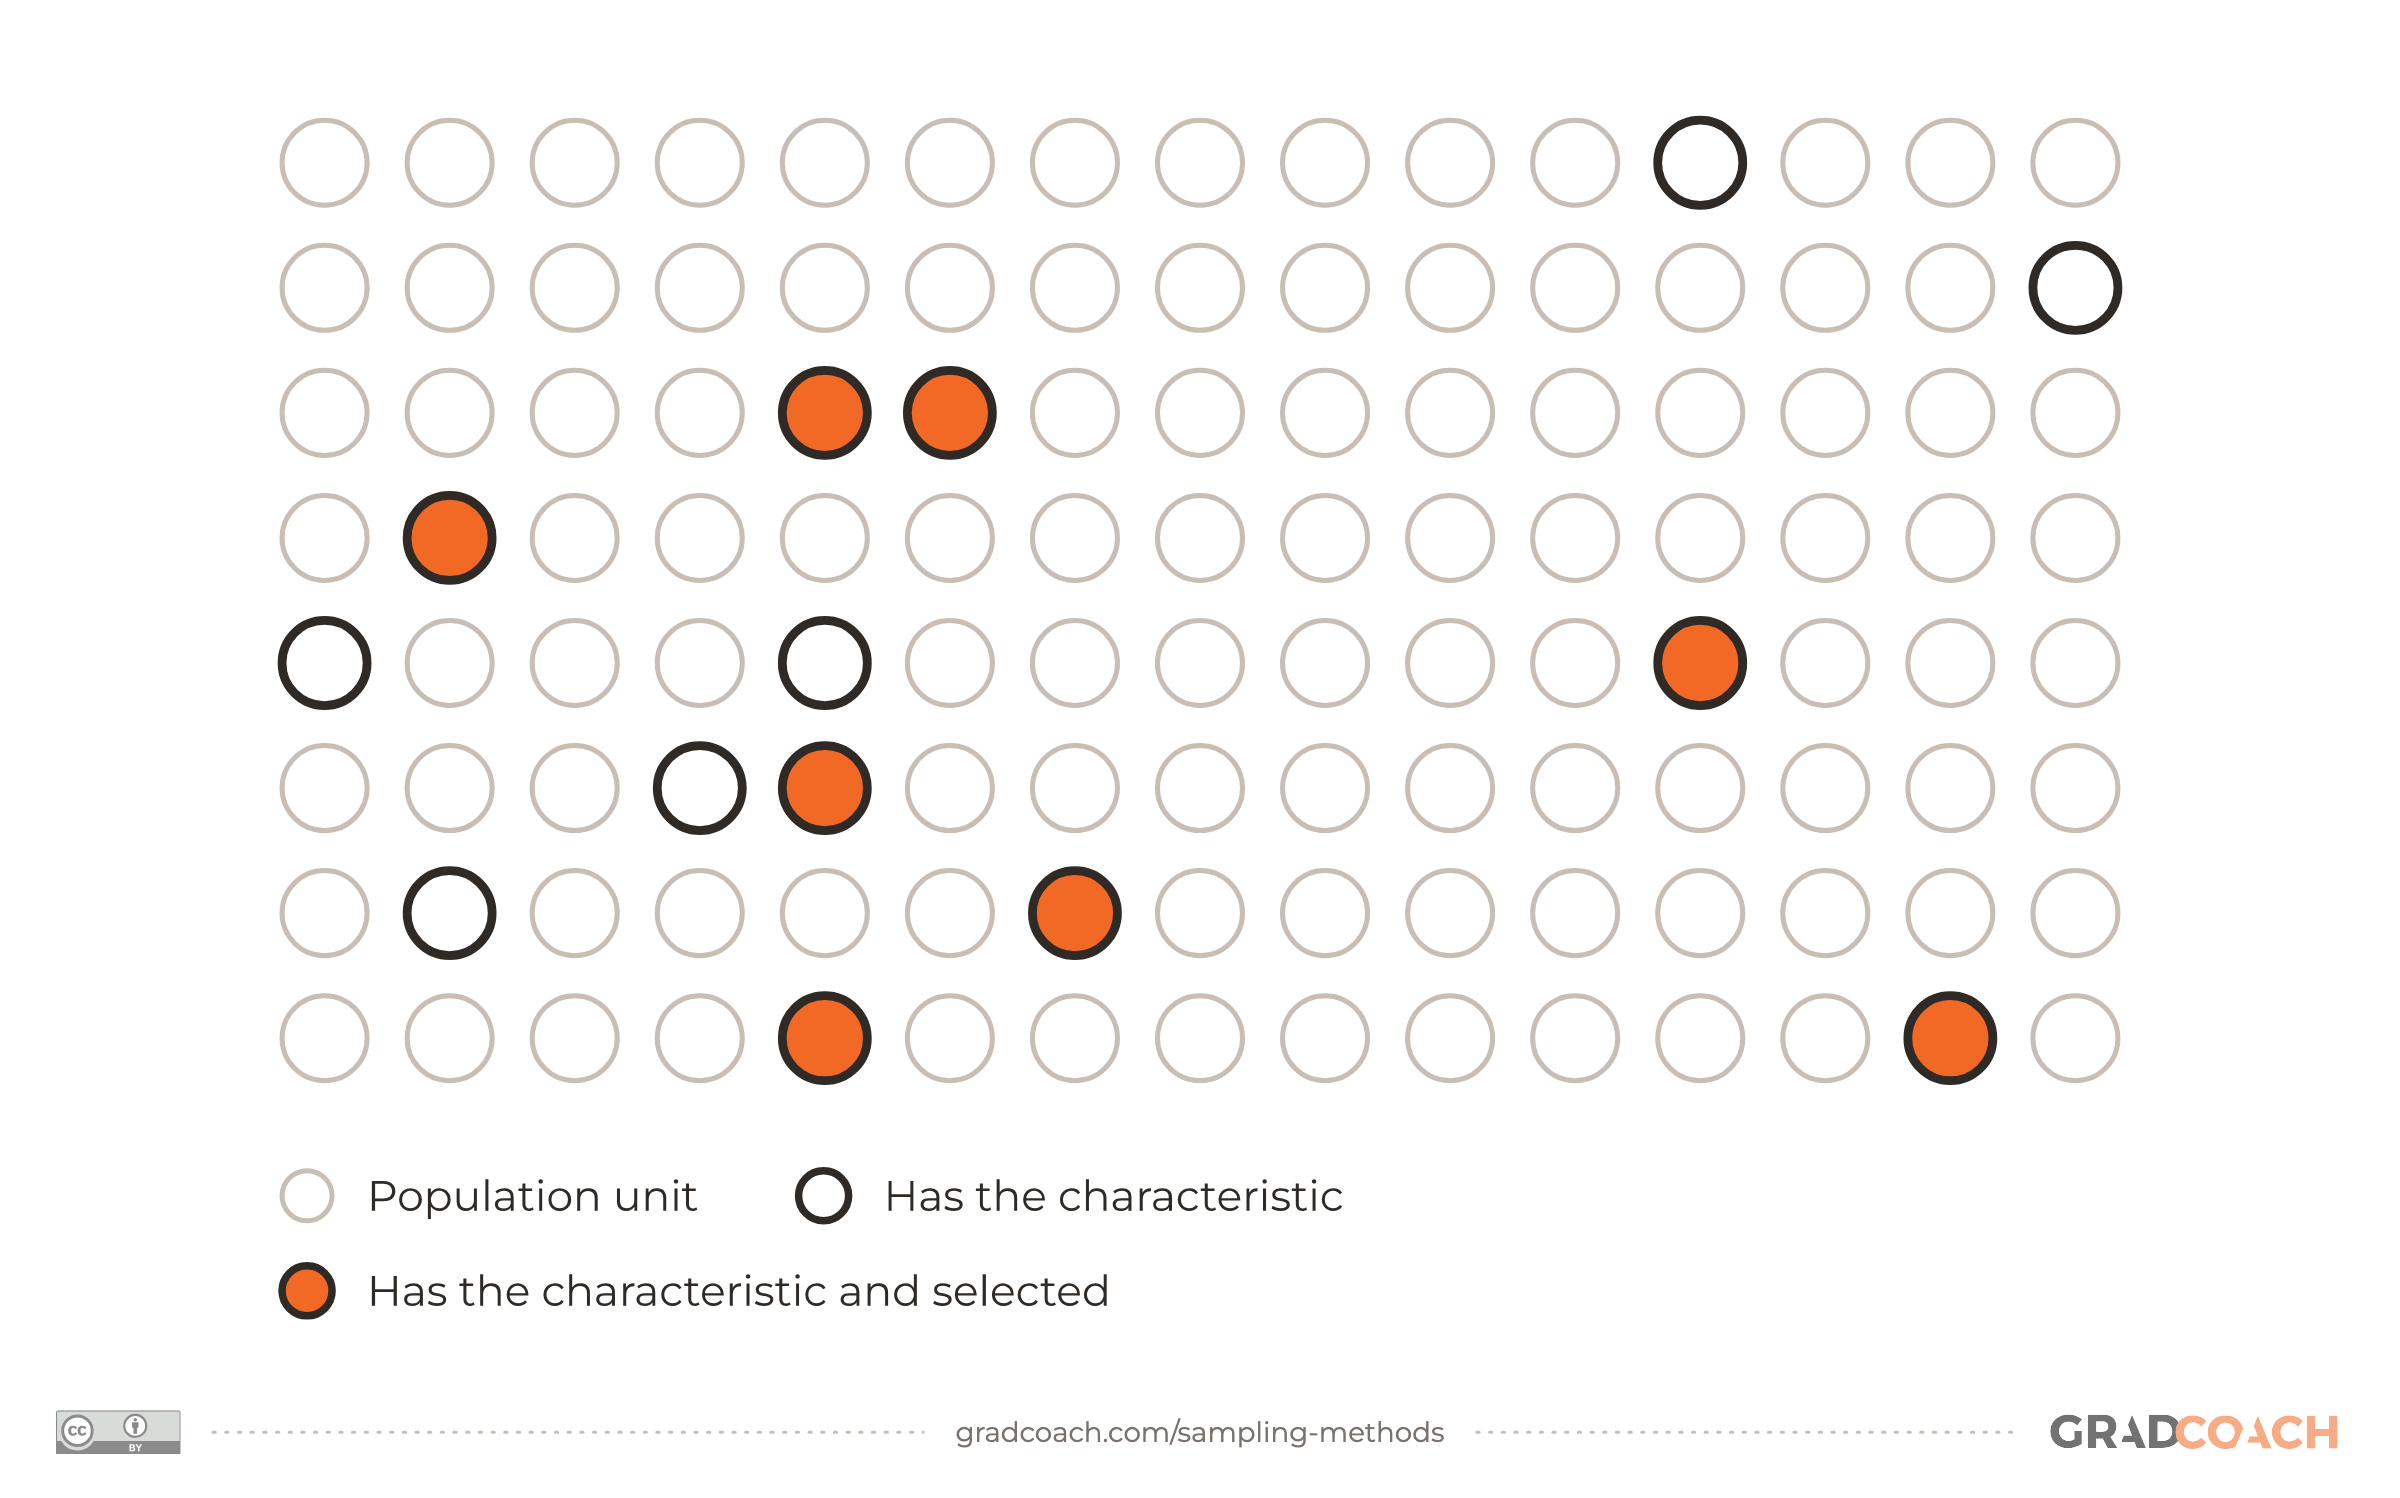
To make the differences easy to see, each method below is drawn on the same population of 120 units, with the selected units filled in.
Simple random sampling
Simple random sampling gives every member of the population the same chance of selection, and every possible group of the size you need the same chance too. It’s the digital version of pulling names out of a hat: you number everyone on your sampling frame and let a random number generator pick. For example, from a list of 500 employees you might draw 50 numbers and survey those 50 people.

Simple random sampling is simple in principle, but it needs a complete list of the population, which many student projects don’t have. Because chance alone decides, a small subgroup can end up with few people, or none, in your sample. If your research questions compare subgroups, that’s a real risk, and the next method exists to remove it.
Stratified random sampling
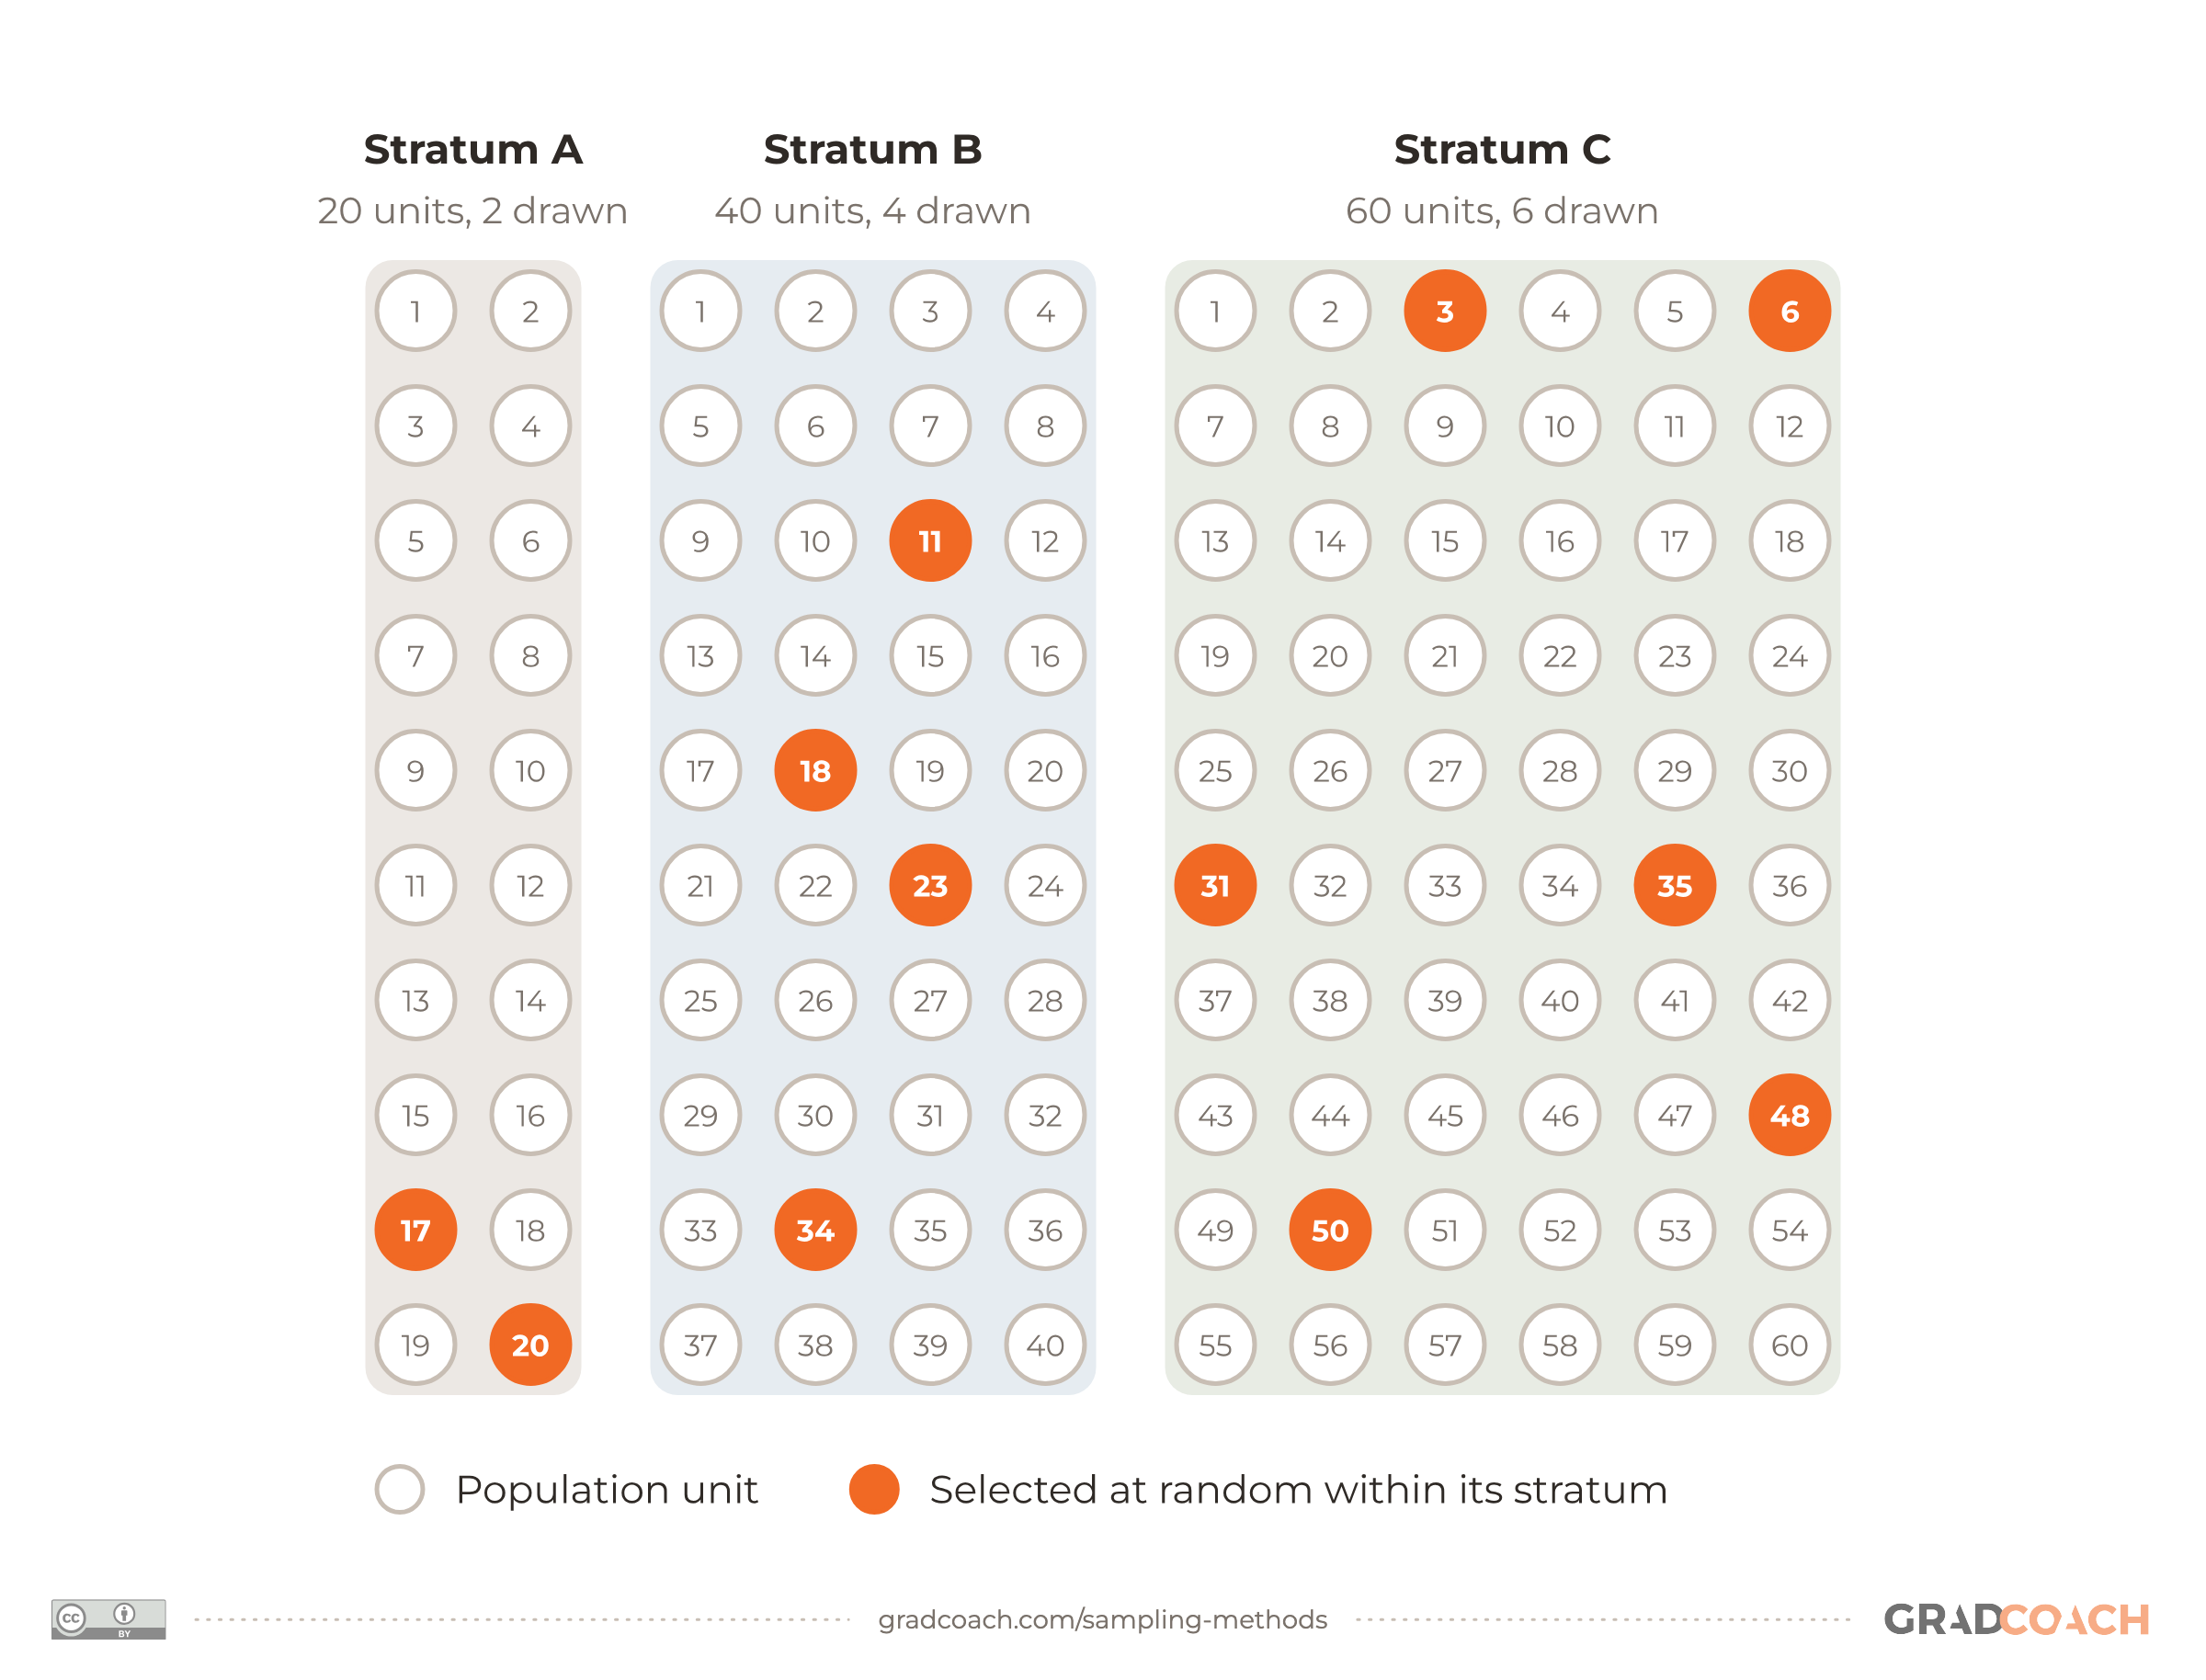
Stratified random sampling divides the population into subgroups that don’t overlap (called strata), based on a trait that matters to your study, such as job role, age band or region. Then it draws a random sample from each stratum separately. Because every stratum is sampled, no subgroup can be missed by chance.

The drawing shows proportionate allocation: each stratum gets the same share of the sample as it has of the population, here 1 in 10.
You don’t have to allocate proportionately, though, and sometimes you shouldn’t:
So decide which job your study needs before you choose an allocation. If you’re comparing subgroups, disproportionate allocation gives each one enough people to say something meaningful about it. If you mainly want to describe the population as a whole, proportionate allocation mirrors the population without any weighting. Either way, state which one you used and why in your methodology chapter, and if you weighted your results, explain how.
Cluster sampling
Cluster sampling starts from groups that already exist in the population, such as schools, clinics or city blocks, called clusters. Instead of sampling people from every group, you randomly select whole clusters and include everyone in them. That’s one-stage cluster sampling, and it’s useful when no list of individuals exists: you only need a list of the clusters.

“How is that different from stratified sampling?”
Both divide the population into groups. The difference is what happens next: stratified sampling draws people from every group, while cluster sampling draws whole groups and ignores the rest. If the city’s 20 blocks were strata, you’d sample households from all 20. As clusters, you visit two.
That usually makes cluster sampling cheaper when your population is spread out, since your fieldwork happens in a handful of places. The cost is precision: how much your results would vary if you drew another sample.
Cluster sampling works best when each cluster is a small-scale version of the whole population, so it doesn’t matter much which ones you draw. As one university statistics guide puts it, “Cluster sampling is ideal when there are not major differences between the clusters.” If people within a cluster tend to be alike (neighbors often are), drawing only two clusters can leave your sample lopsided.
When clusters are large, you can sample again inside them instead of taking everyone, which turns the design into multistage sampling: districts, then blocks within them, then households within those. Large national surveys combine several of these methods, and if your dissertation uses one as secondary data, your job is to describe its design accurately. Here’s a Cornell PhD in applied economics doing it in three sentences. Count the methods named in the second:
Notice the three layers: stratified (the design runs separately within each stratum), two-stage (areas first, then households) and cluster (the enumeration areas). The last sentence then says which levels the sample can speak for. If you’re using survey data you didn’t collect, make sure your write-up gives your committee (your examiners, in the UK) what this passage gives its readers: who designed the sample, how it was drawn and which populations it represents.
Systematic sampling
Systematic sampling selects every kth person on a list, starting from a random point inside the first interval. You work out the interval (k) by dividing the population by the sample you need.
Say your population is 120 people on a numbered list and you want a sample of 8. The interval is 120 ÷ 8 = 15. You pick a random start between 1 and 15 (say 11), then take every 15th person after it: 11, 26, 41, 56, 71, 86, 101 and 116.

The random start matters, because it’s what gives everyone on the list a chance of selection, which makes this a probability method. Starting from a fixed point, or from one outside the first interval, quietly breaks that.
The list itself doesn’t need to be shuffled, but it mustn’t have a pattern that repeats in step with your interval. Imagine a staff list that runs one manager, then their 14 team members, then the next manager. With an interval of 15, you’d land on the same position in every team, so your sample would contain every manager or none of them. If your list has any order like that, shuffle it first or switch to simple random sampling.
Non-probability-based sampling methods
Here are the four non-probability methods you’ll meet most often in dissertations and theses:
None of them gives everyone a known chance of selection, so none supports statistical generalization. What separates a strong non-probability sample from a weak one is how clearly you explain who you chose and why.
Purposive sampling
Purposive sampling, also called judgment, selective or subjective sampling, means you choose participants deliberately because they have the knowledge or experience your research questions need. Done well, it’s more demanding than it looks. A paper on purposive sampling in nursing research notes that new nurse researchers tend to see it as either simple or too difficult, and “may therefore default to using a convenience sample for the wrong reasons.”

Suppose your study compares what keeps a retailer’s most loyal customers coming back with what keeps its occasional shoppers away. A random sample would mostly give you people in the middle, so you’d deliberately recruit from both extremes. Purposive sampling is also how a Delphi study’s expert panel is chosen: by written criteria, not at random.
The method’s weakness is that your judgment shapes the sample, so it’s open to researcher bias. The fix is to make the judgment visible: write down your criteria and where you found people. The extract below, from a public health PhD at Calgary, shows how it recorded the expert sample for an international survey:
Each source of names is specific enough for someone else to follow. The same section then sets a target (at least two experts of each kind from each of four countries, plus more from elsewhere in Europe), which tells a reader the selection followed a plan. In your own write-up, name your criteria and your sources in the same breath.
Convenience sampling
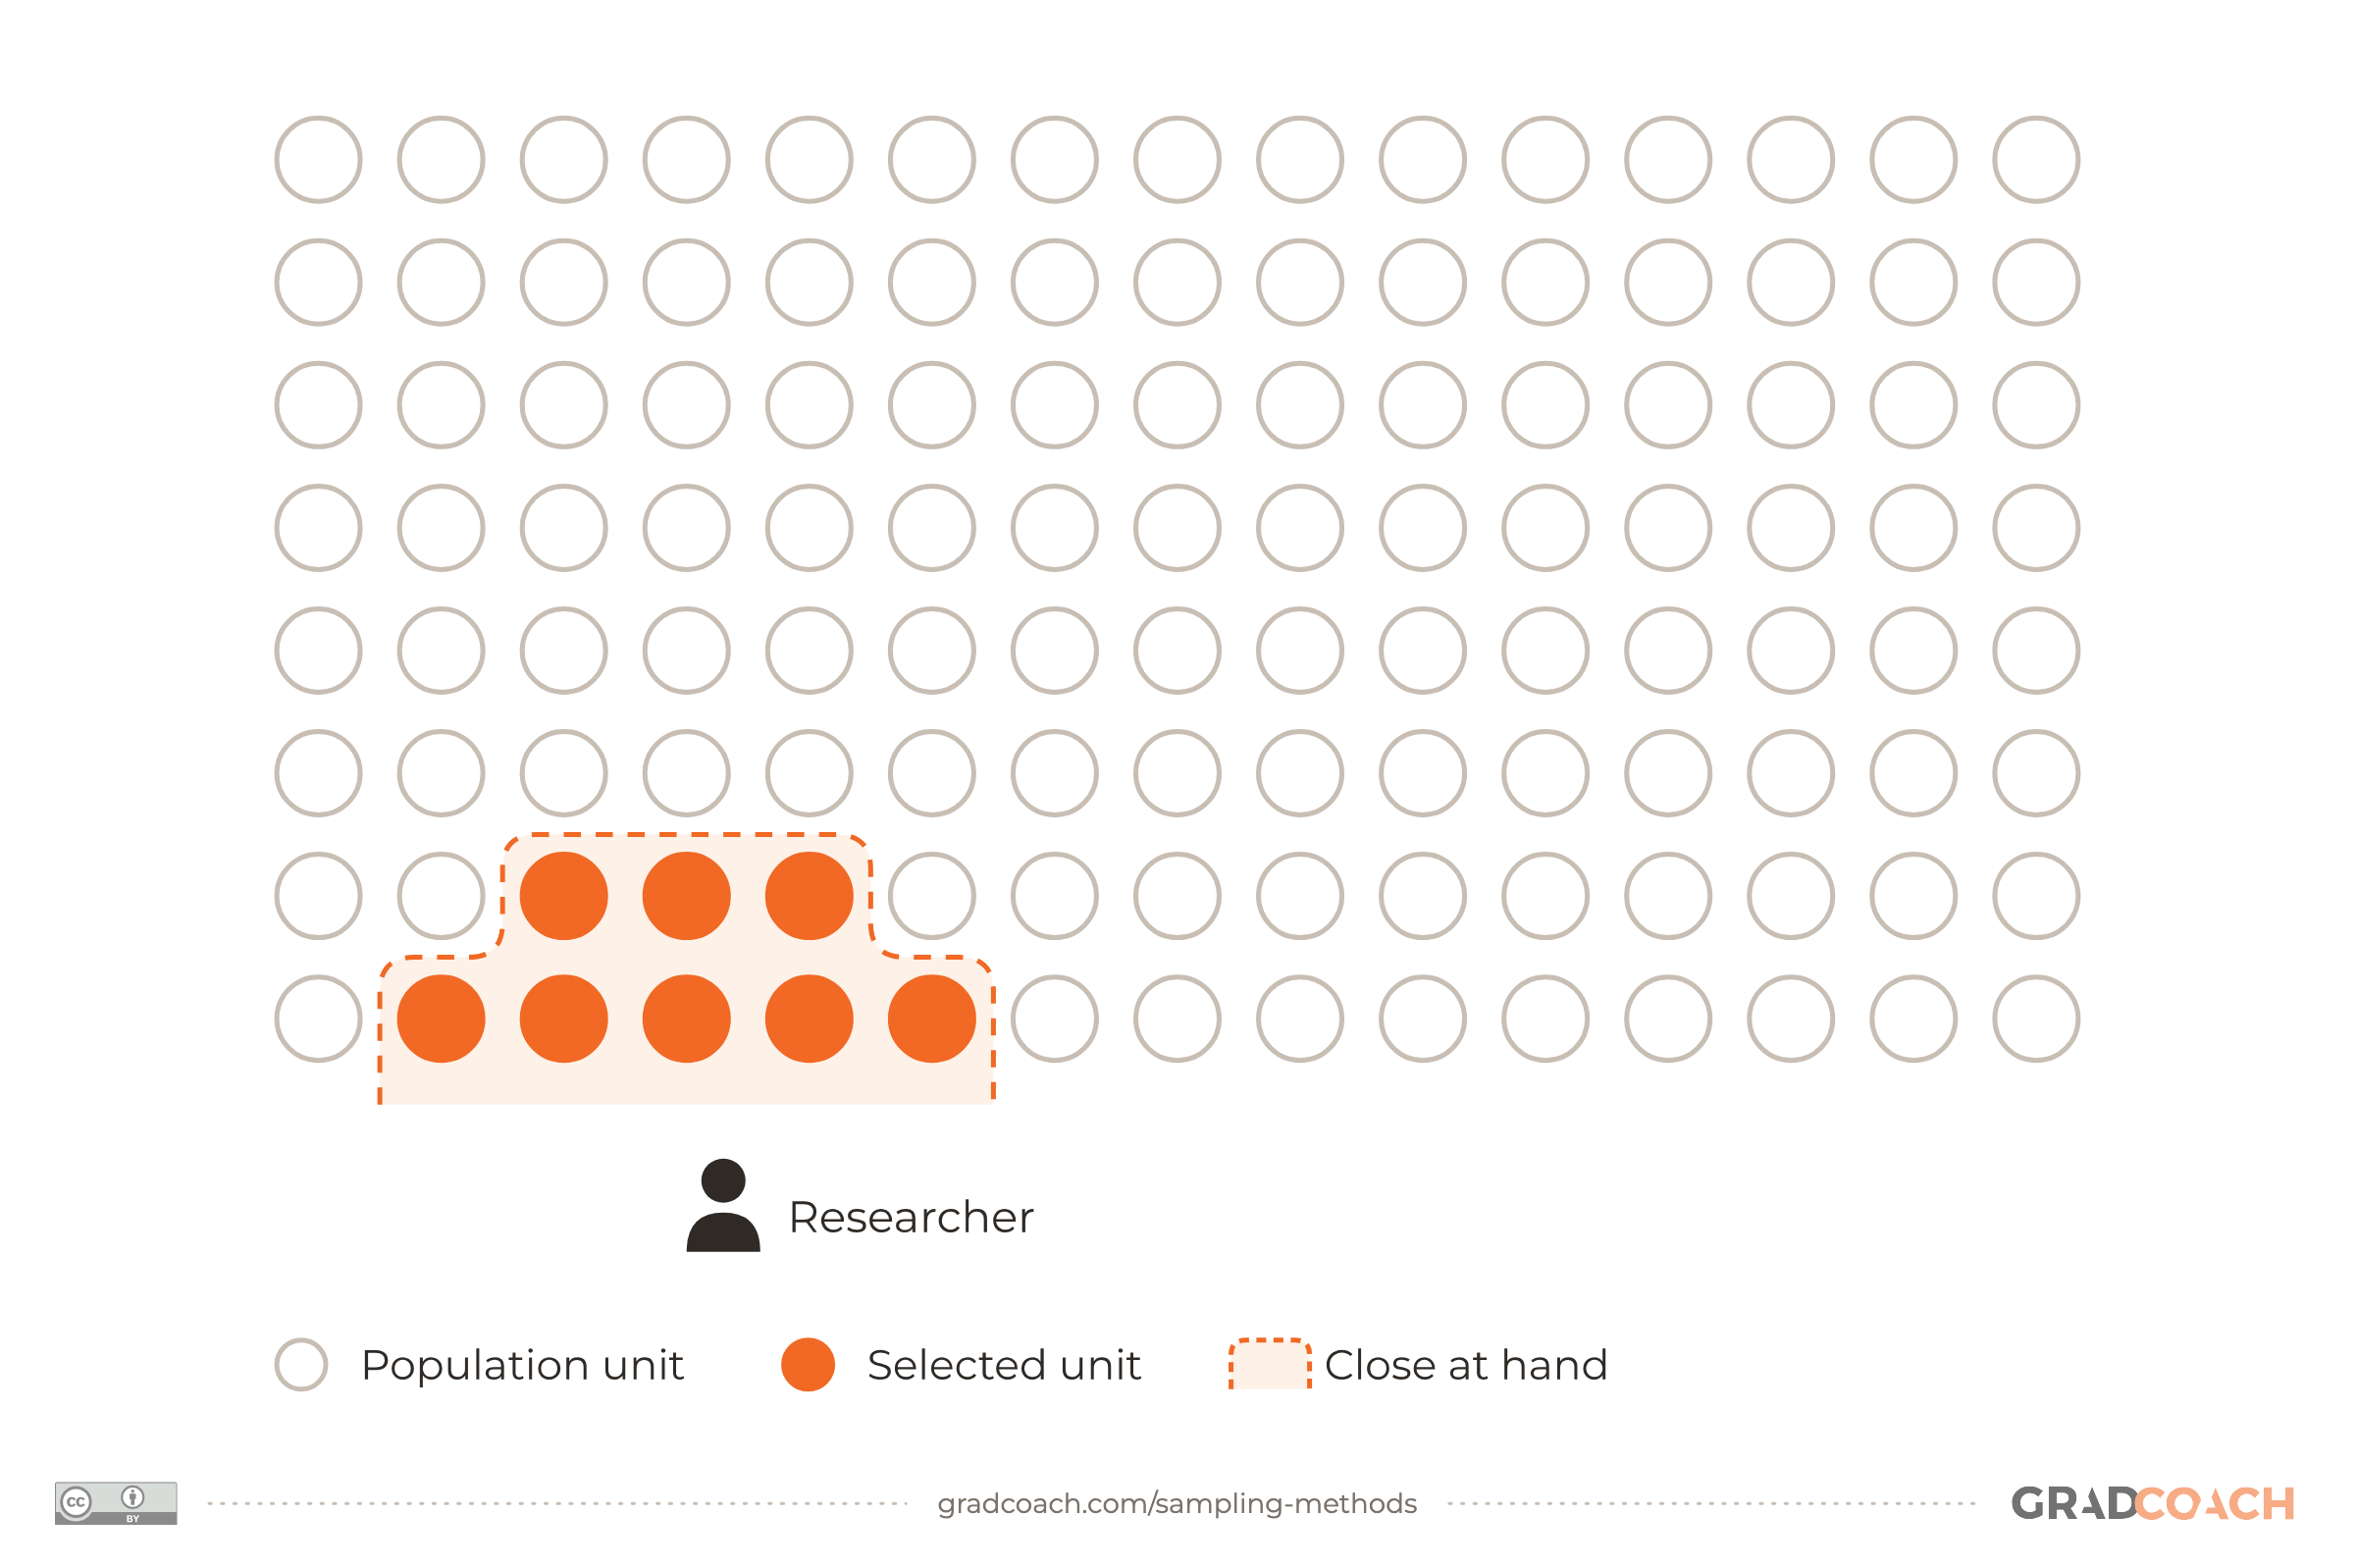
Convenience sampling takes whoever is easiest to reach: people in your workplace, your classes, your social media network. It’s quick and cheap, which is why so many dissertations use it, and it’s often a sensible choice for piloting a questionnaire before the main study.

The problem is that the people closest to hand are rarely typical of everyone else, and nothing in the method tells you how they differ. Let’s look at a real-world example. The business PhD below surveyed online shoppers in Vietnam, and the age breakdown at the end of the passage shows what convenience can do to a sample:
Over four in five respondents were 18 to 25, which suggests the Facebook-and-sharing route reached young users far more than older ones. To the thesis’s credit, its limitations section says so directly: “the sample representation is limited primarily to young, urban consumers in Hanoi”. That’s what I’d want from any convenience sample: report who you actually got, and scope your conclusions to them.
Snowball sampling
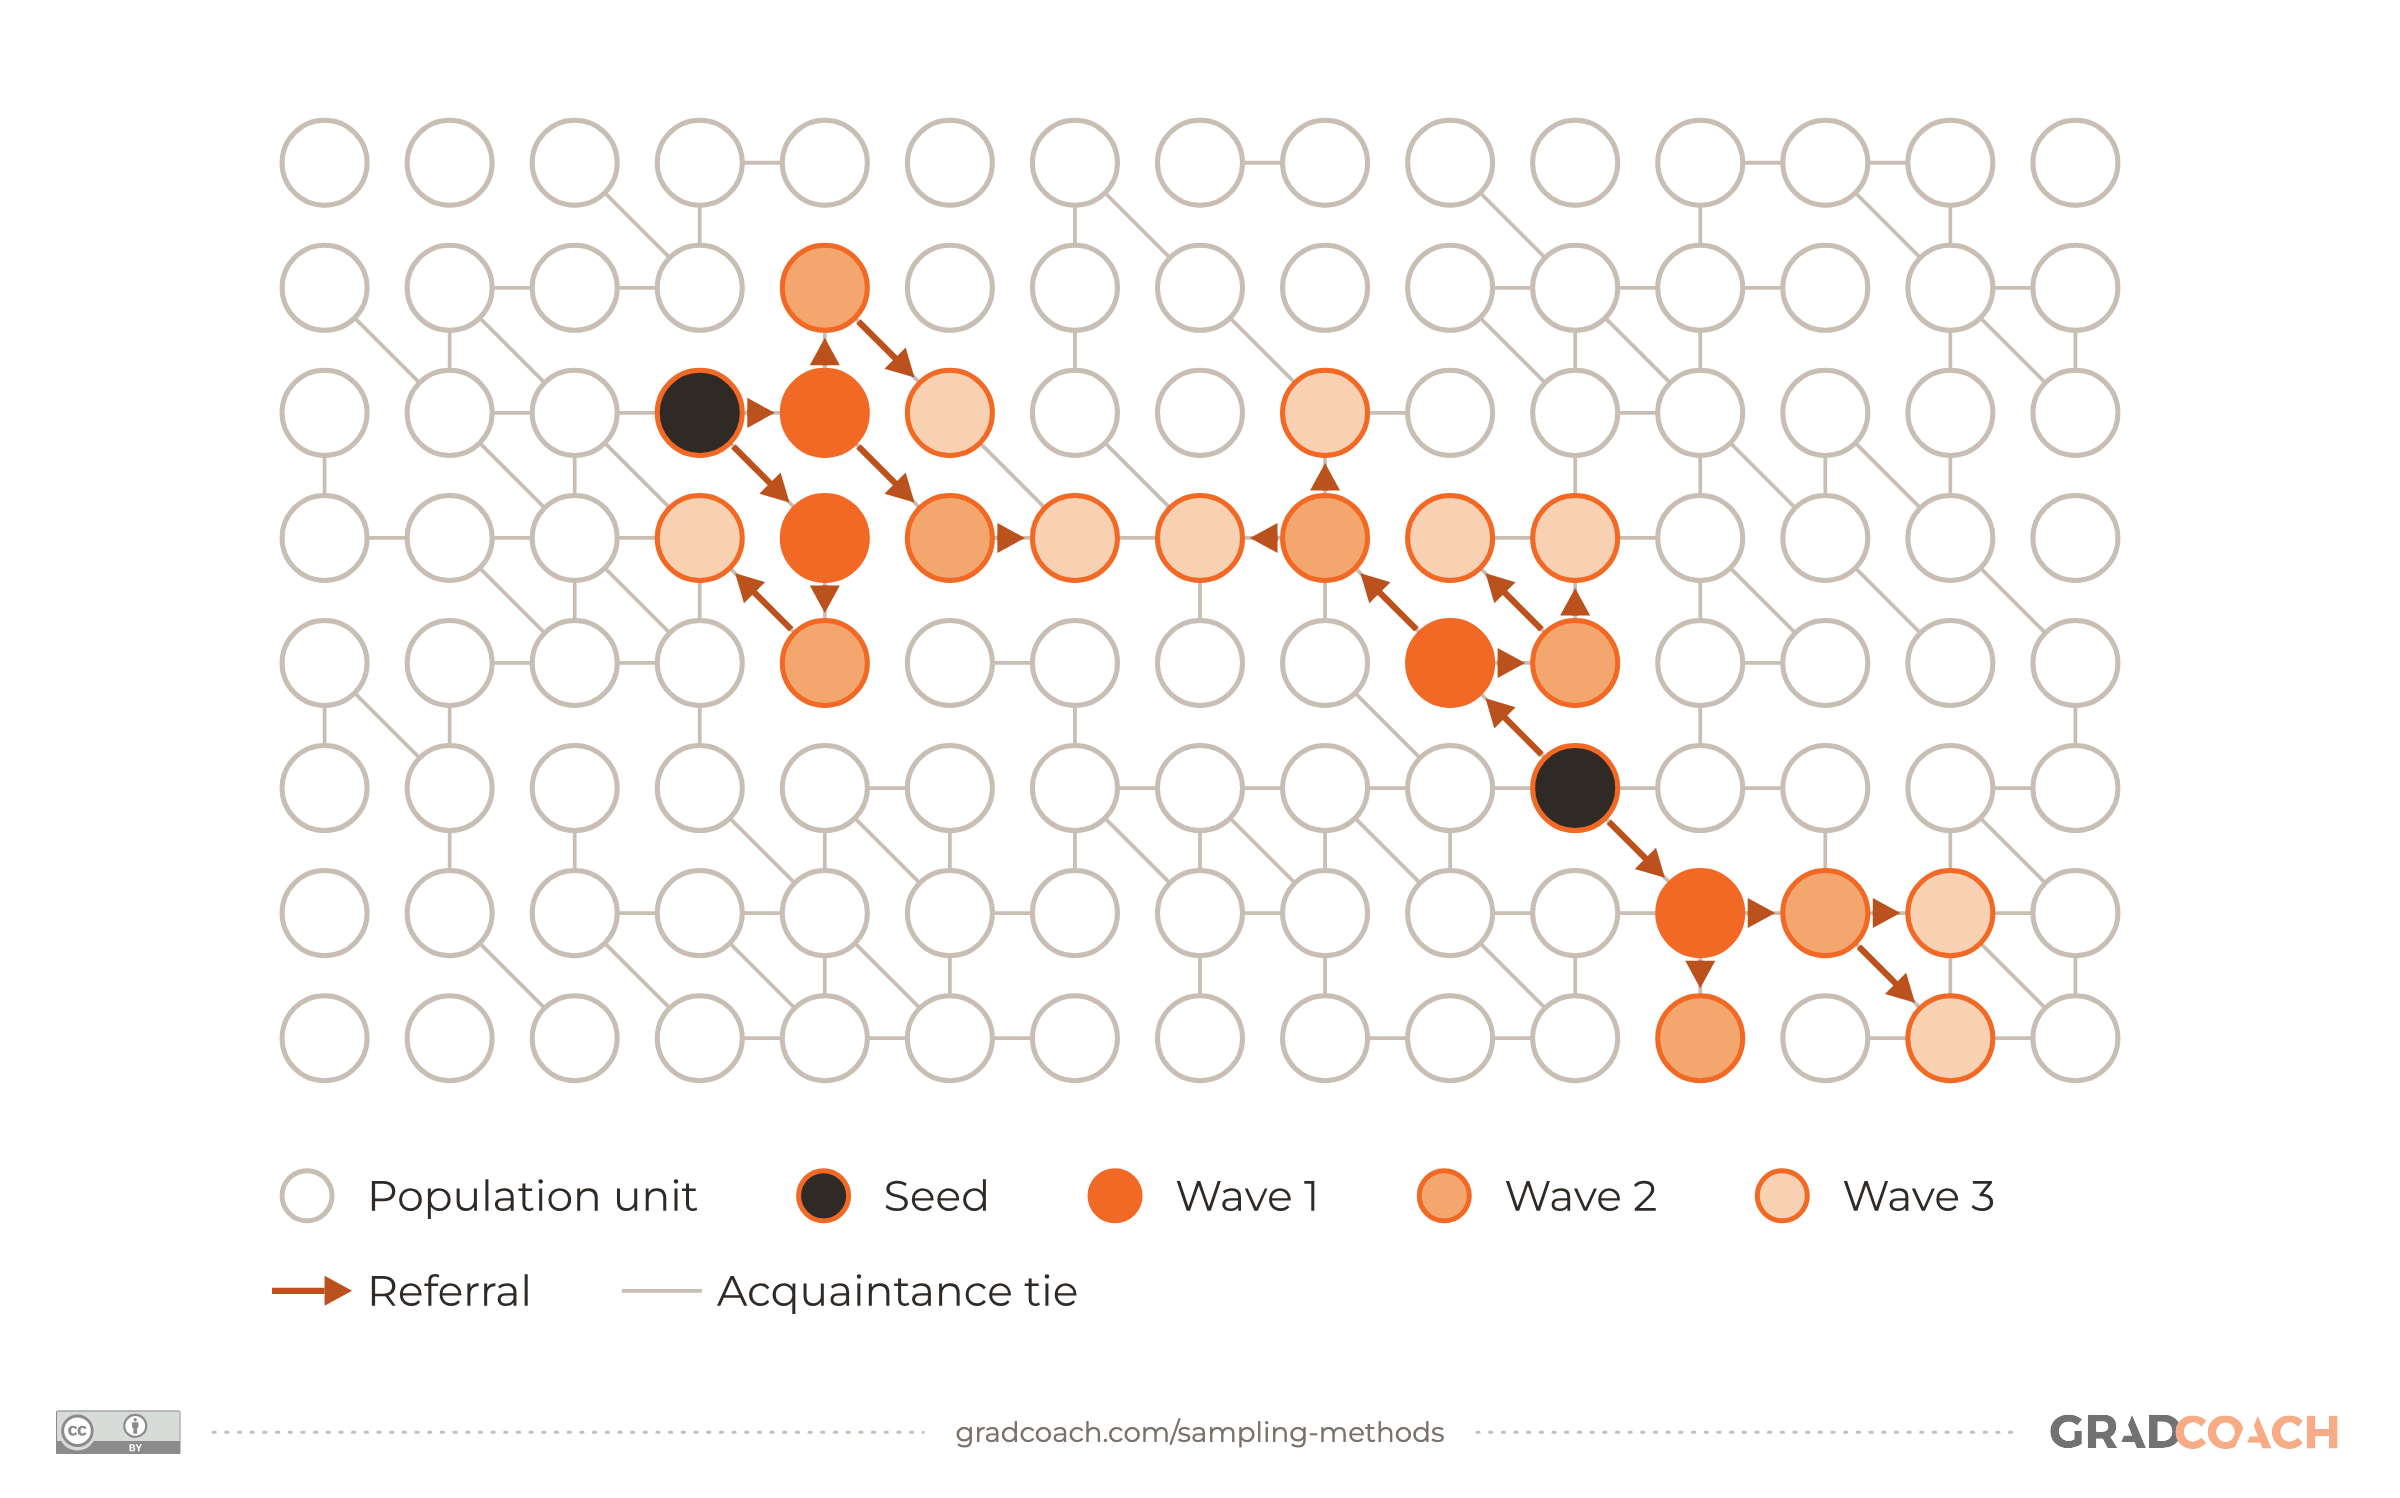
Snowball sampling recruits through referrals: your first participants (the seeds) suggest others, who suggest others in turn, so the sample grows as it rolls along. It’s the method for populations with no list to sample from, such as people with a rare condition, members of a closed professional world, or anyone discussing a sensitive topic who’d only talk to you on a trusted introduction.
Here’s the chain growing from two seeds:

Its weakness is built in. You can only reach people connected to your seeds, so your sample inherits their networks and their blind spots. The extract below, from a political science PhD on land reform in South Africa, shows three ways to push against that:
Look at how the chain is built. It starts from several seeds in different sectors, so no single network dominates, and it asks for people “with different viewpoints”, so the referrals don’t just echo the referrer. Then it steps outside the networks entirely with cold calls. If you use snowball sampling, name your seeds by type and say how you widened the chain beyond them.
Quota sampling
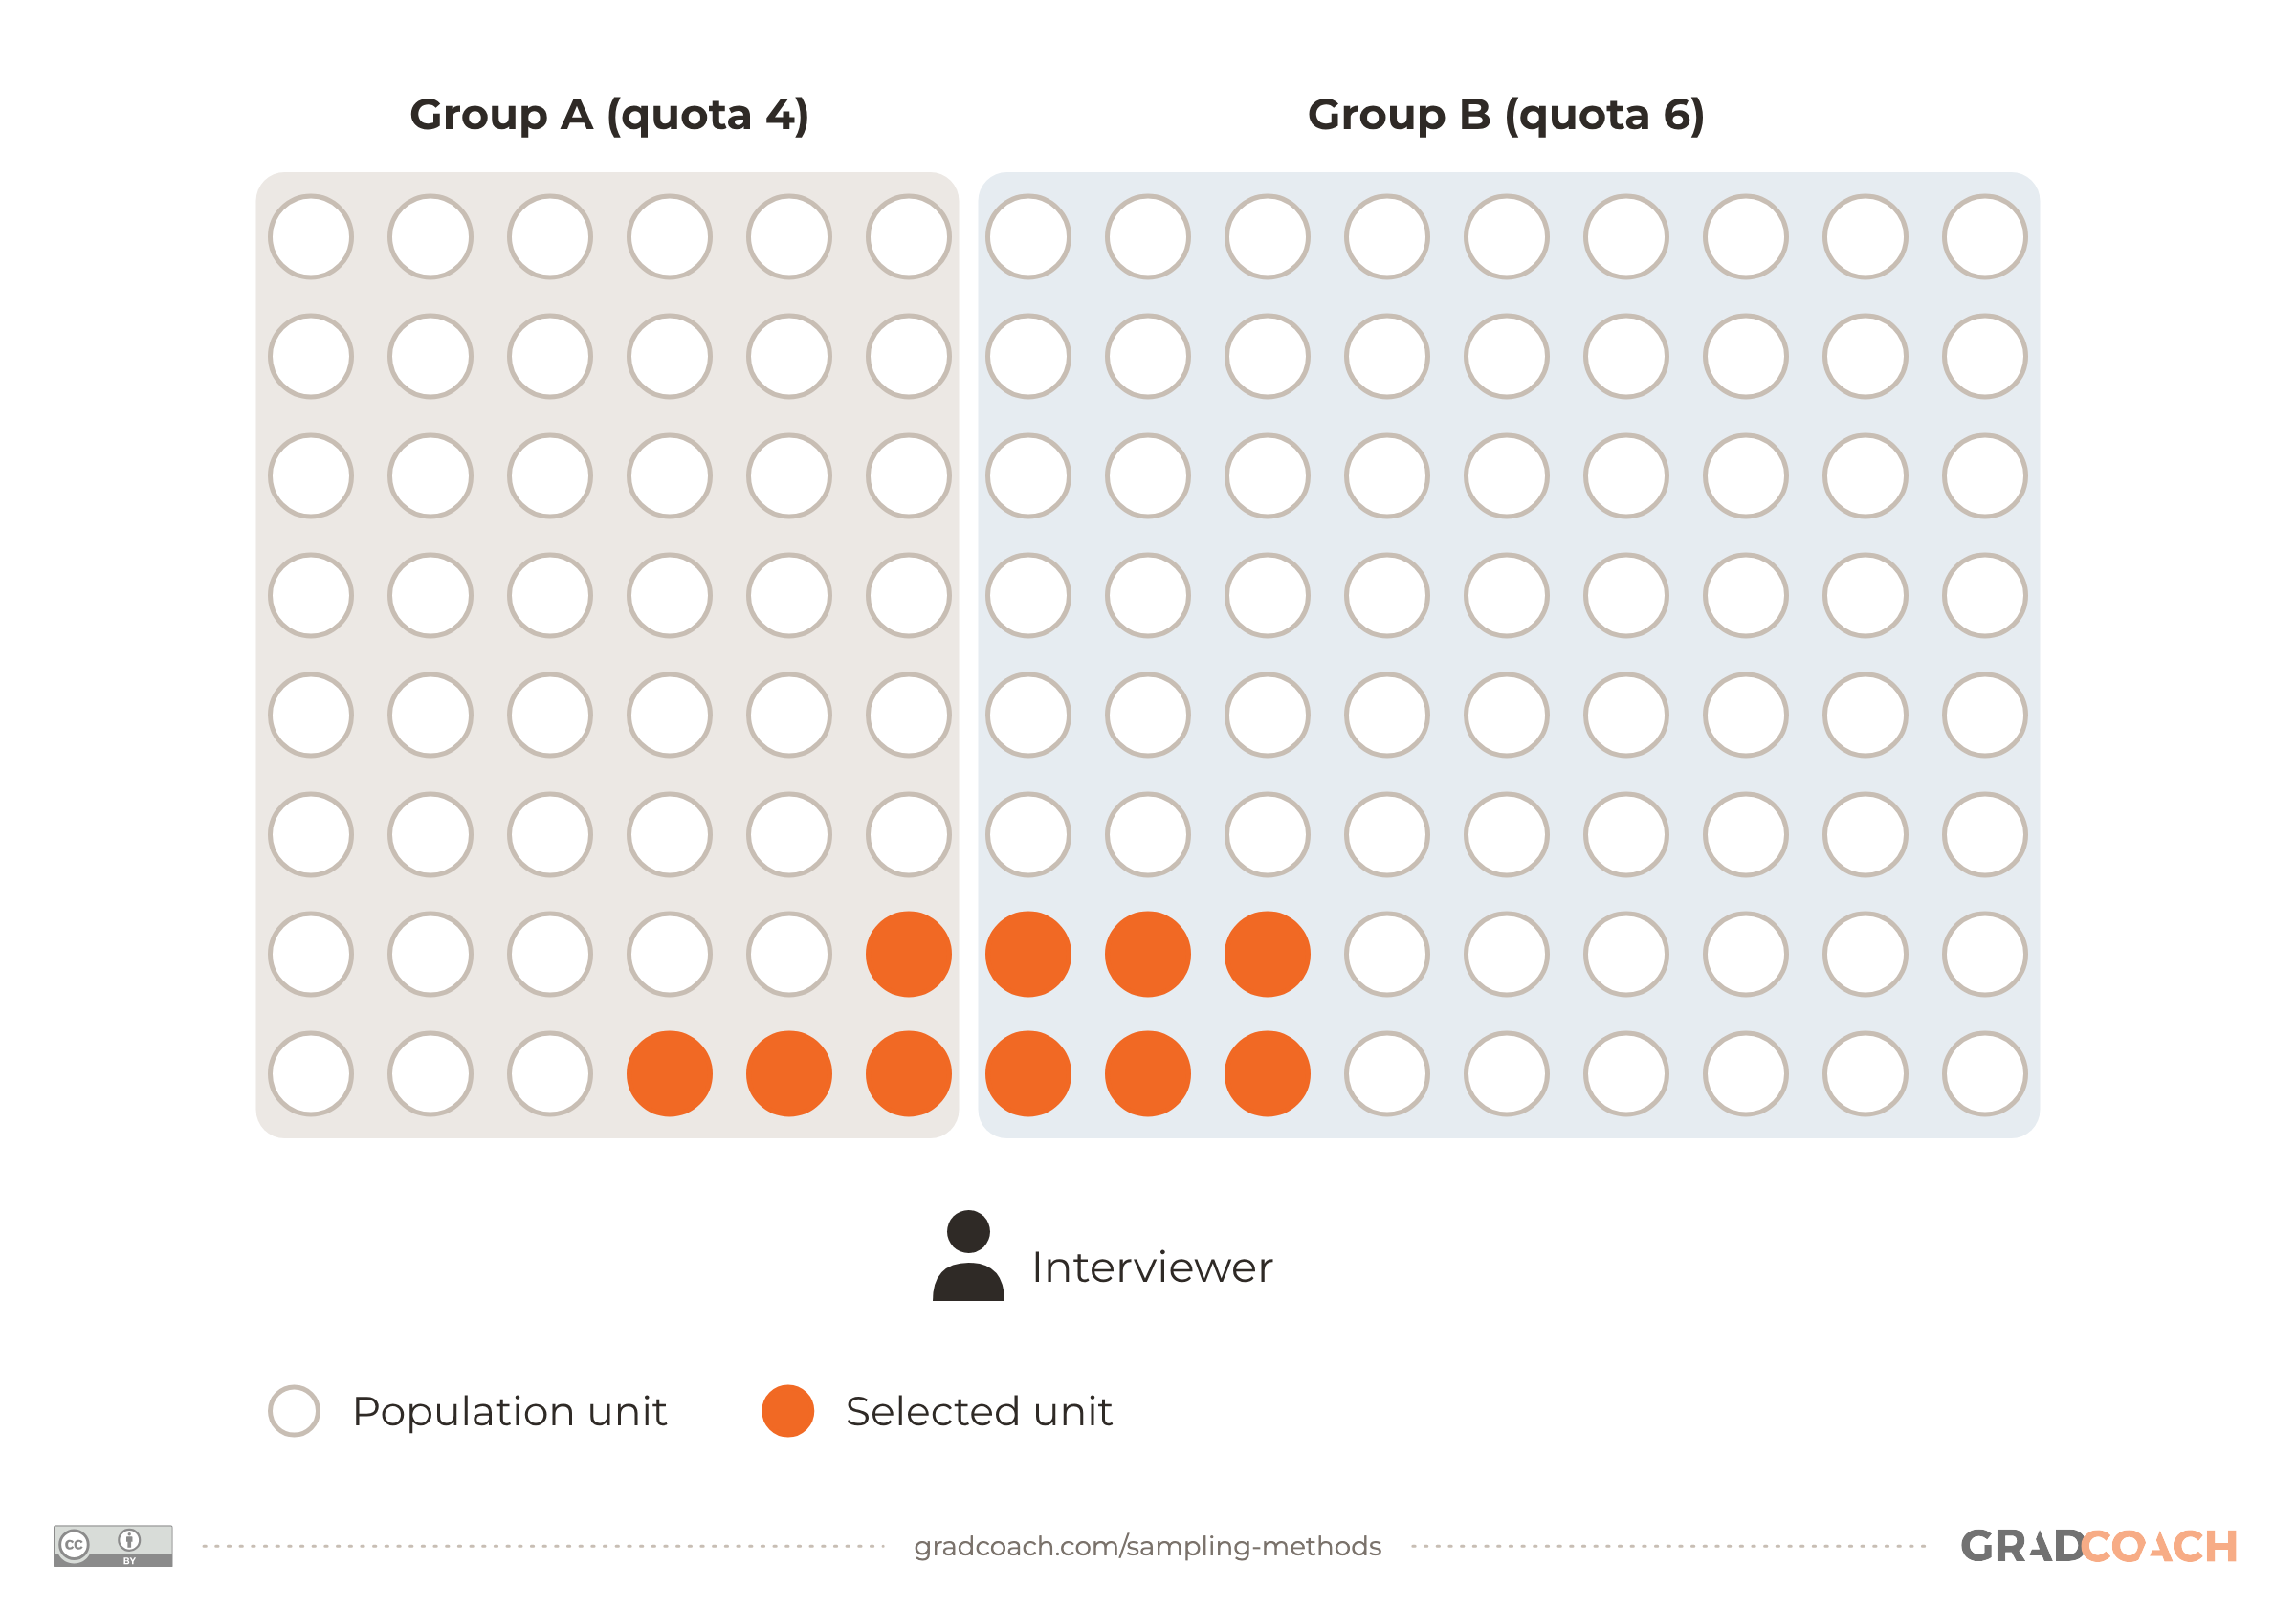
Quota sampling looks like stratified sampling at first. You divide the population into groups and set a number to recruit from each, usually in proportion to the population (if 40% of your population is over 50, 40% of your sample will be too). The difference is the second step: you fill each quota however you can, usually with whoever is available, rather than at random.
That keeps the sample’s mix right on the traits you set quotas for, and on nothing else. A quota sample of shoppers can have exactly the right age split and still contain only people who shop on weekday mornings, because that’s when you stood outside the store.
On the same population of 120, quota sampling looks like this:

I’d use it only when you need a balanced mix and can’t get a list to sample from at random, and I’d report it as non-probability sampling, because that’s what it is.
How many people should you sample?
Knowing the methods is half the job. The other half is the number, and the logic differs by family.
If you’ll run statistical tests, your sample size should come from a power analysis that matches your planned test: the smallest sample that gives you a good chance of detecting the effect you’re looking for. Rules of thumb exist (the Vietnam thesis quoted above cites one in its methodology, at least five respondents per questionnaire item), but a power analysis is the justification a committee can check.
If you’re interviewing, the usual argument is saturation: you’ve collected enough when new interviews stop adding new insights. That sounds vague, but there are numbers behind it. A systematic review of empirical saturation studies summed up what they found:
Most of those studies measured code saturation, the point where no new codes appear. Studies that tested meaning saturation (understanding each theme in depth) or ran across several countries needed larger samples.
Doctoral studies have tended to run larger. An analysis of 560 UK and Irish PhD theses using qualitative interviews, searched in 2009, found a median of 28 participants and a mean of 31. It also found that 20 and 30 were the most common sample sizes, which the author read as numbers chosen in advance rather than at saturation.
So a round number with no reasoning attached won’t impress anyone. Instead, plan a range and say what would tell you to stop. For interviews, that’s saturation, shown in your own data. For a survey, it’s the number your power analysis gives you (or, if you’re only estimating a figure, a margin-of-error calculation), plus extra for people who don’t respond or drop out.
How to choose a sampling method
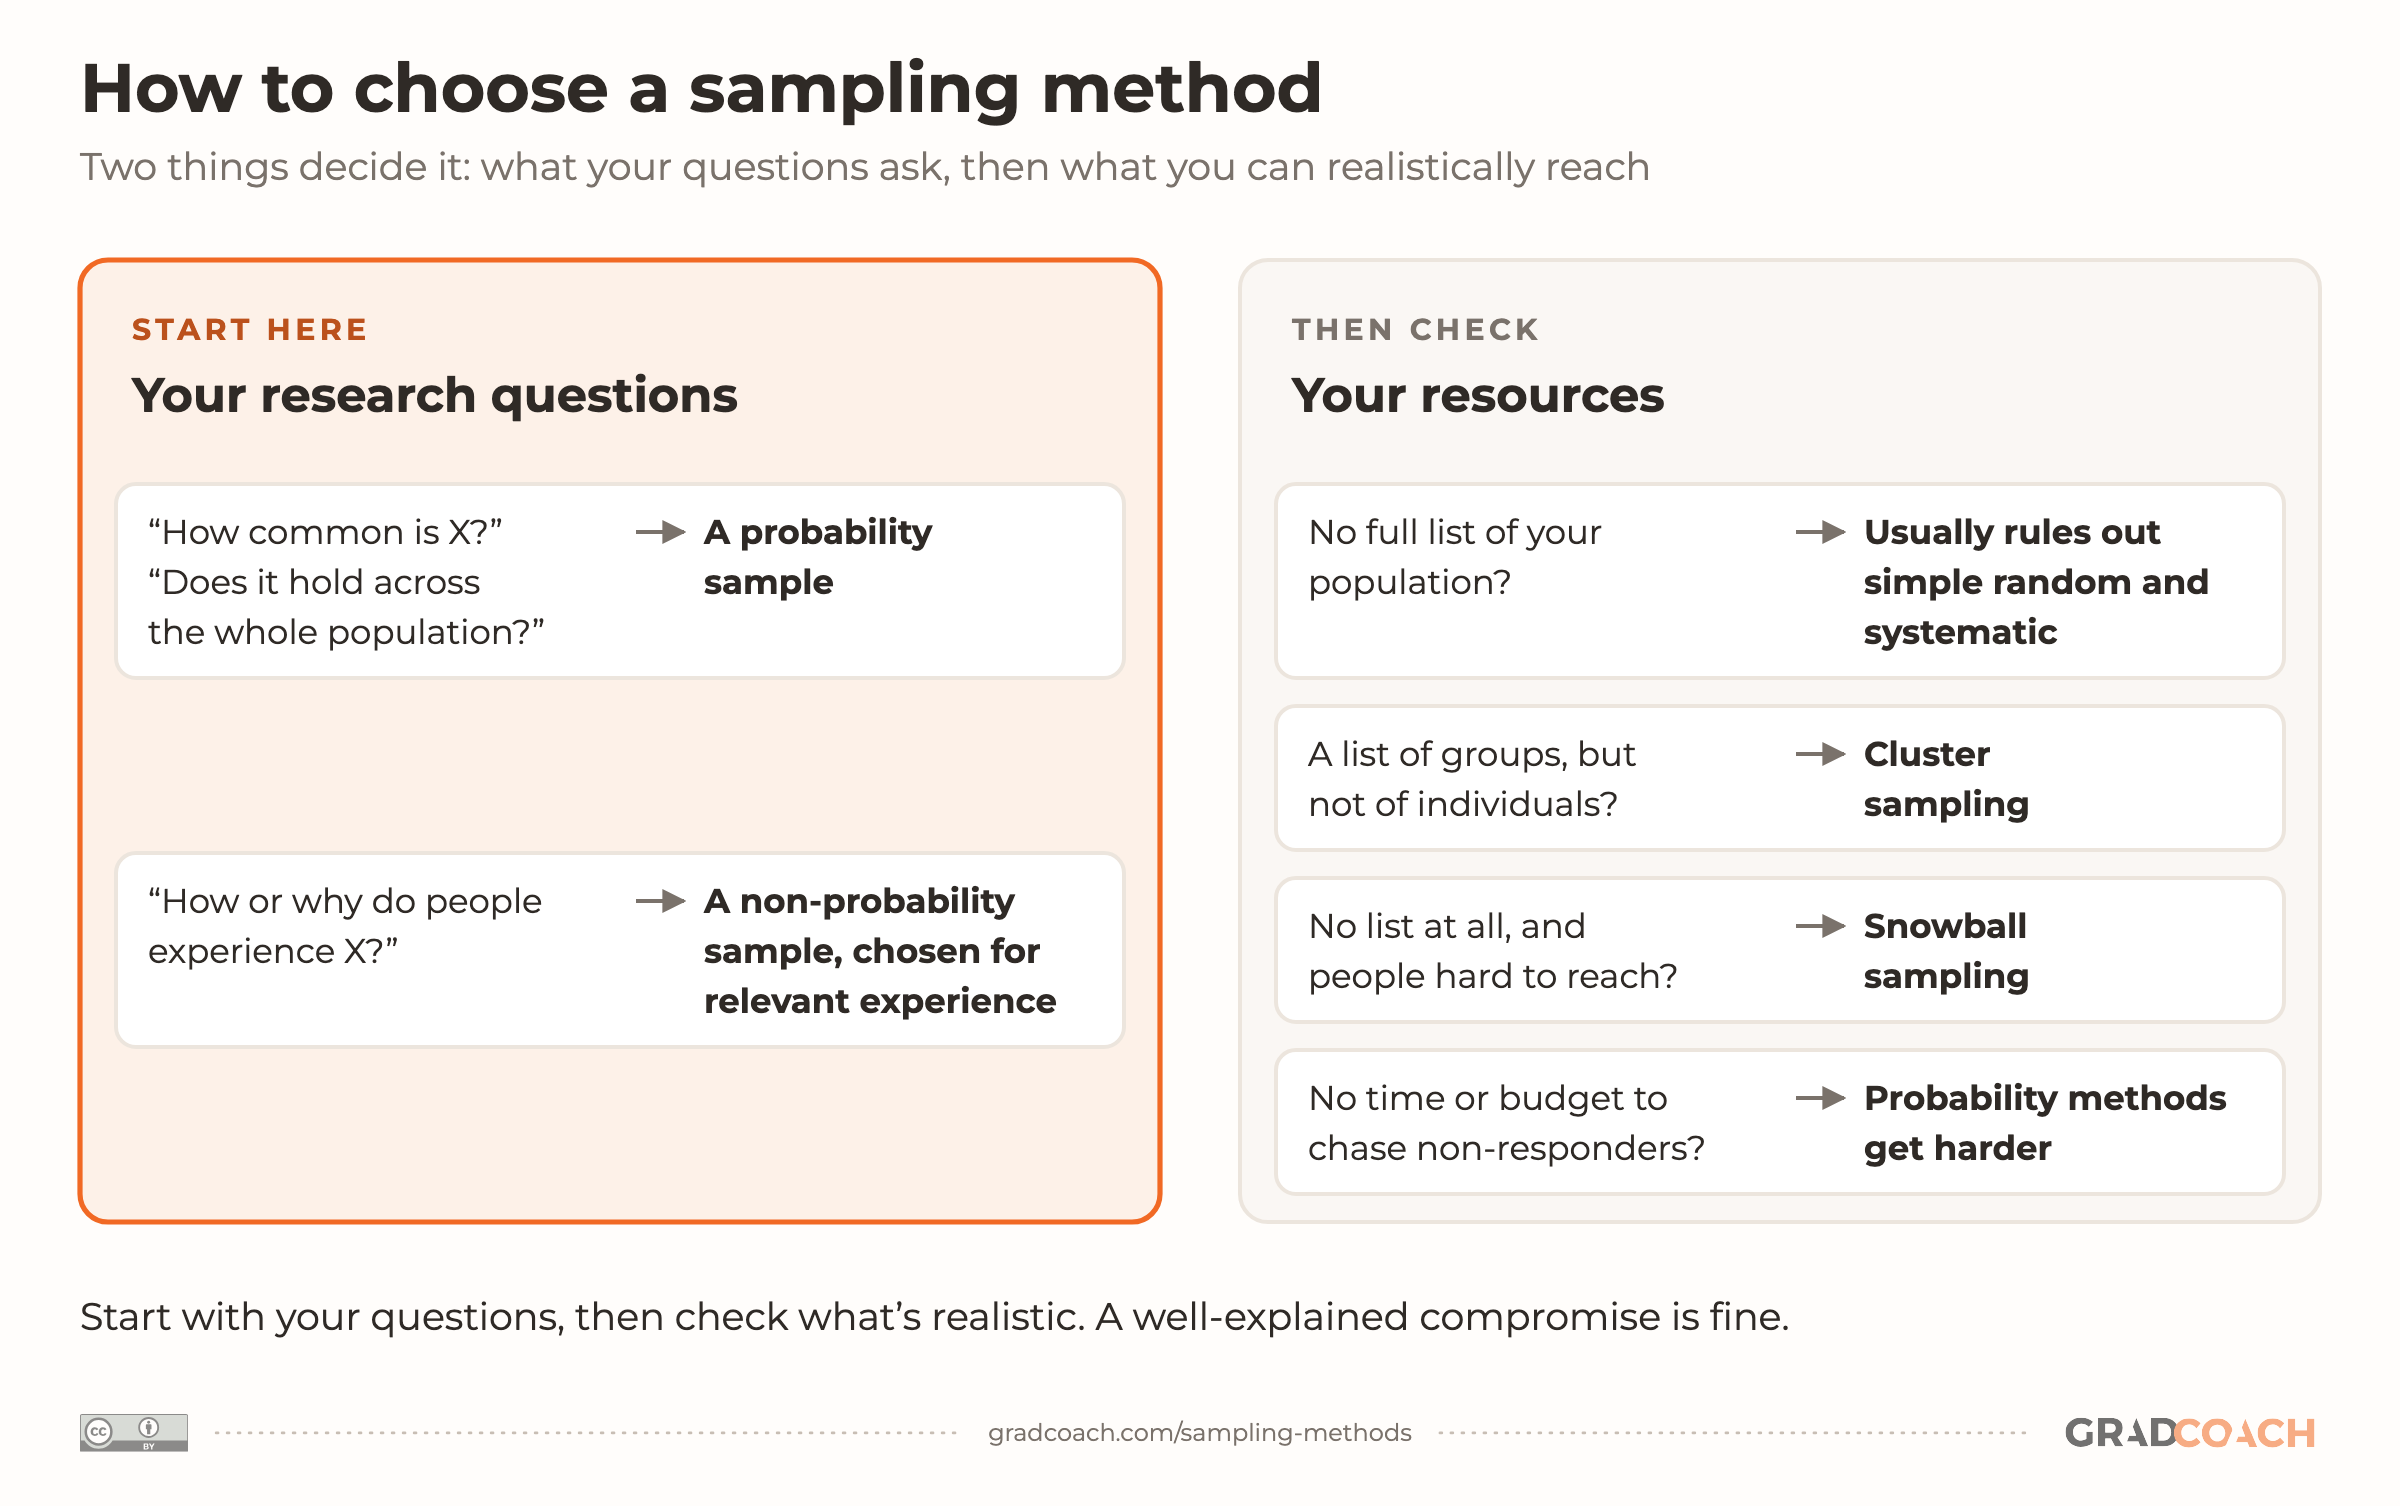
Two things decide it: your research questions and your resources. The drawing below shows how each one narrows your options:

If your questions ask how common something is, or whether a finding holds across a whole population (“What proportion of first-year nurses consider leaving within a year?”), you need a probability sample. If they ask how or why people experience something (“How do first-year nurses decide whether to stay?”), a non-probability sample chosen for relevant experience usually fits better. As with every other design decision, the method has to follow from your aims, objectives and the questions your study asks.
On the resources side, probability methods need a list of your population, so without one, simple random sampling is out. Systematic sampling is the exception: it can work without a list if you sample a flow instead, such as every 10th visitor through a door.
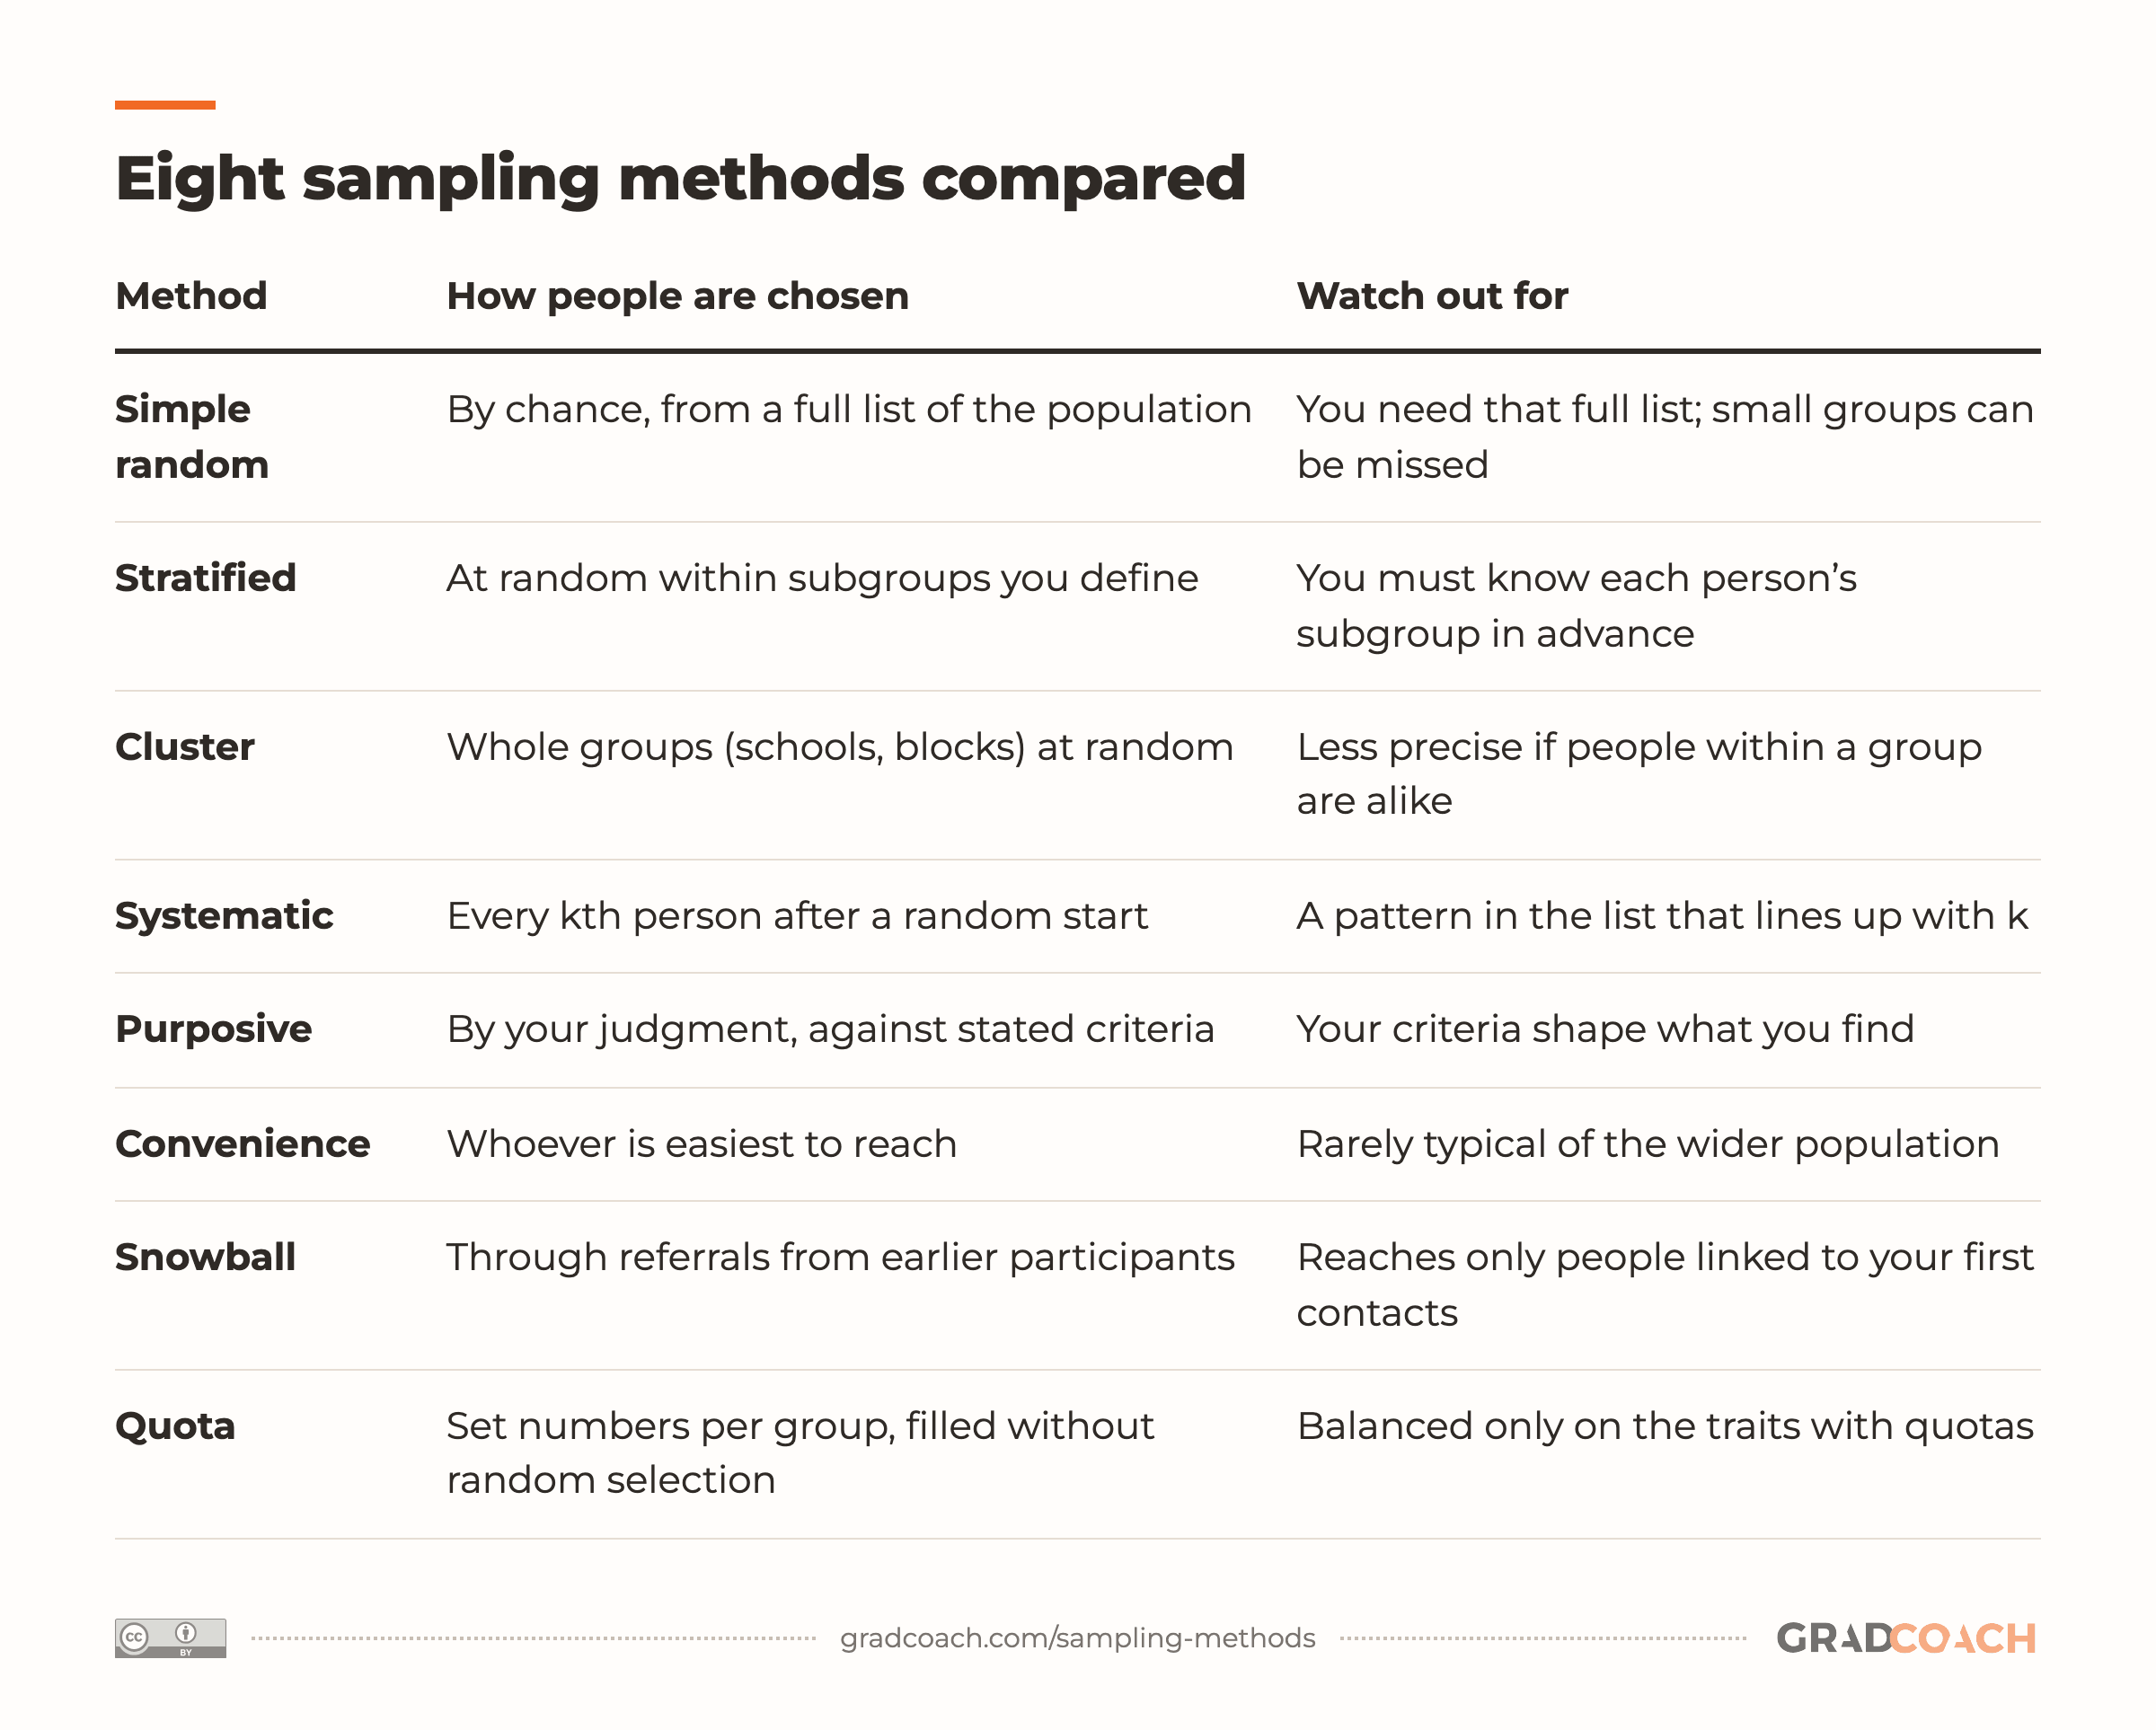
This table puts the eight methods side by side:
| Method | How people are chosen | Watch out for |
|---|---|---|
| Simple random | By chance, from a full list of the population | You need that full list; small groups can be missed |
| Stratified | At random within subgroups you define | You must know each person’s subgroup in advance |
| Cluster | Whole groups (schools, blocks) at random | Less precise if people within a group are alike |
| Systematic | Every kth person after a random start | A pattern in the list that lines up with k |
| Purposive | By your judgment, against stated criteria | Your criteria shape what you find |
| Convenience | Whoever is easiest to reach | Rarely typical of the wider population |
| Snowball | Through referrals from earlier participants | Reaches only people linked to your first contacts |
| Quota | Set numbers per group, filled without random selection | Balanced only on the traits with quotas |
The first four are probability methods and the last four are not. If your ideal method is out of reach, that’s normal. In my experience, most student studies settle for less. Pick the strongest method you can actually carry out, then write up what it costs you.
Where students go wrong
Three mistakes turn up regularly in the sampling sections we see in coaching, and each one is easy to fix once you can see it.
Naming the route instead of the method. “Participants were recruited through social media” tells your committee how you reached people, not how you chose them. A shared post usually produces a convenience or voluntary response sample (people who chose to answer), or a snowball one if people passed it on, and the method needs naming as well as the route.
Borrowing a method’s name. Theoretical sampling comes from grounded theory, where your ongoing analysis decides who you speak to next. If you chose everyone up front against fixed criteria, that’s purposive sampling, and calling it theoretical invites a question you can’t answer.
Treating a number as a rule. Twelve interviews, thirty, four hundred survey responses: these figures circulate as fixed rules, often quoted without the conditions their sources attached. Your number needs the reasoning set out in the sample-size section above, not a figure borrowed from someone else’s study.
All three come down to the same habit: describe what you actually did, in the method’s proper terms, and let the reasons follow.
How to justify your sampling choice
A strong sampling section answers the questions your committee would otherwise ask. In my experience, it needs five things:
- The population and the frame: who you wanted to study, and the list or route you used to reach them.
- The method, named and defined, with a methods source.
- Why it fits your research questions, in a sentence that links the two directly.
- The recruitment detail: inclusion and exclusion criteria, how you contacted people, how many you approached and how many took part.
- What the sample can and can’t support, with any shortfall carried into your limitations section.
Each of the four dissertation extracts above covers several of those points, and none of them is long. If you want to see where the sampling section sits among your other design choices, check out our guide to writing the methodology chapter.
Still have questions?
Which sampling method is the most biased?
Of the common methods, convenience and voluntary response samples are generally considered the most prone to selection bias, because the people who end up in them are the ones who were easy to reach or who chose to respond, and those people often differ from everyone else in ways the researcher can’t measure. That doesn’t make either method unusable, but it does mean the findings describe the people sampled rather than a wider population.
Which sampling method is the most reliable?
If you want to generalize to a population, a probability method drawn from a complete, accurate sampling frame is the most reliable choice, because chance rather than the researcher decides who is included. Simple random, stratified, cluster and systematic sampling all qualify when they’re carried out properly. In a qualitative study, reliability means something different: a sample whose selection criteria you can state and defend.
Can you combine two sampling methods in one study?
Yes, and many studies do. Qualitative studies often start with a purposive sample and then add snowball sampling to reach people the researcher couldn’t find directly. Large surveys commonly stratify the population and then sample clusters within each stratum. If you combine methods, name each one and say which part of the sample it produced.
Is purposive sampling the same as purposeful?
In practice, yes: the two terms are used interchangeably for choosing participants deliberately because of what they know or have experienced. One public health PhD from the University of Calgary describes the same expert survey as “purposeful sampling” in one section and “purposive and snowball sampling” a few pages later. Pick one term and use it consistently in your own chapter.
What is voluntary response sampling?
Voluntary response sampling is a non-probability method in which people put themselves forward, for example by answering an open online survey link or a call for participants. It’s easy and cheap, but the people who volunteer are often those with the strongest views or the most time, so the sample can lean in ways that are hard to detect.
Does a convenience sample make my study invalid?
No. A convenience sample limits what you can generalize to, not whether your study is worth doing. Many approved dissertations use one. The key is to describe exactly who took part and keep your claims to that group, then discuss the limitation openly.
Can’t find your answer here? Ask a Grad Coach directly – the initial chat is free.
Speak with a friendly coach →


Cite-worthy sources
Cite this article
Jansen, D. (2023). Sampling Methods & Strategies 101. Grad Coach. https://gradcoach.com/sampling-methods/
- Campbell, S., Greenwood, M., Prior, S., Shearer, T., Walkem, K., Young, S., Bywaters, D., & Walker, K. (2020). Purposive sampling: Complex or simple? Research case examples. Journal of Research in Nursing, 25(8), 652-661.
- Chauhan, T. (2024). Essays on financial inclusion, extreme weather events and development [Doctoral dissertation, Cornell University].
- Dyzenhaus, A. (2022). The price of redistribution: Local markets and agriculture in South Africa’s land reform program [Doctoral dissertation, Cornell University].
- Esmail, R. (2020). Understanding the relationship between health technology reassessment and knowledge translation [Doctoral dissertation, University of Calgary].
- Hennink, M. M., & Kaiser, B. N. (2022). Sample sizes for saturation in qualitative research: A systematic review of empirical tests. Social Science & Medicine, 292, 114523.
- Luong, V. D. (2025). Factors influencing e-commerce consumer’s adoption intention towards collection-and-delivery points (CDPs): The case of Vietnam [Doctoral dissertation, University of Lincoln].
- Mason, M. (2010). Sample size and saturation in PhD studies using qualitative interviews. Forum Qualitative Sozialforschung / Forum: Qualitative Social Research, 11(3), Article 8.
- National University Library. (n.d.). Statistics resources: Sampling methods.