
Free download
Statistics Cheat Sheet
Our go-to statistics cheat sheet, the tests you'll actually run. Free to download. Instant access.
Your cheat sheet is ready
It opens in a new tab, so this page stays right where it is.
Open your cheat sheet


Developed by Grad Coach's Doctoral-Qualified Team15 Million Downloads · Used by 500+ Universities
4.9 Stars
Client Satisfaction
10,000+
Students coached
100%
Client Pass Rate
15 Million
Video Lesson Downloads
What it covers
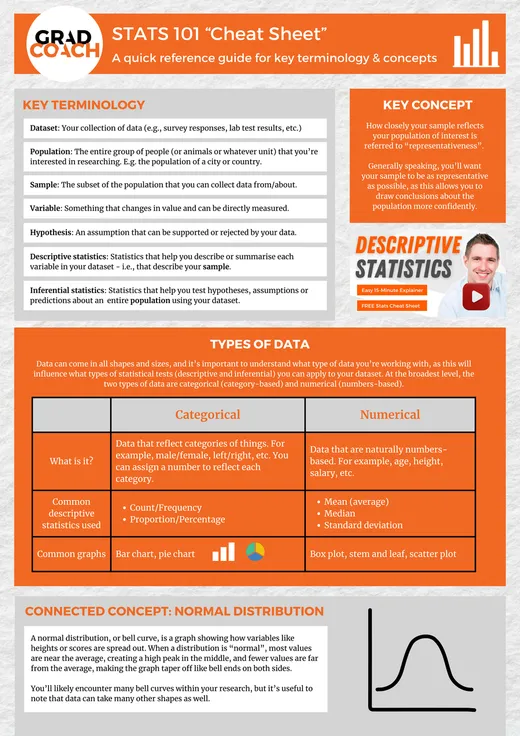
A single reference sheet covering the descriptive and inferential techniques a dissertation actually uses, in plain language, the same shorthand we’ve used with 10,000+ students.
A PDF, formatted for A4. Print it, or keep it open in a tab while you write.
Frequently asked questions
What’s actually in the cheat sheet?
Three pages: one on core vocabulary and the two data types (categorical and numerical) plus the normal distribution; one on descriptive statistics (mean, median, standard deviation, frequency and proportion); and one on inferential statistics, covering the t-test, chi-squared test and correlation (Pearson and Spearman), their non-parametric alternatives (the Mann-Whitney U-test and Fisher’s exact test), a shorter note on ANOVA and multiple regression, and how to read a p-value and effect size.
Is this a how-to guide or just a reference?
It’s a reference, not a how-to guide. It’ll remind you what a chi-squared test is for or what “effect size” means when you’re staring at your output, but it won’t walk you through running a test in SPSS, R or Excel, or tell you which one fits your specific data and design.
What separates descriptive stats from inferential ones?
Descriptive statistics summarize your own sample: the mean, median and standard deviation of the data you actually collected. Inferential statistics use that sample to make a claim about the wider population, which is where tests like the t-test and chi-squared test come in.
Should I use a t-test, chi-squared or correlation?
It comes down to your variable types. A t-test compares a numeric outcome across two groups, chi-squared compares two categorical variables, and correlation looks at the relationship between two numeric variables (Pearson for parametric data, Spearman when it isn’t). Past two groups, ANOVA takes over from the t-test, and Mann-Whitney U and Fisher’s exact test are the non-parametric alternatives for small or skewed samples.
What do “p-value” and “significance level” mean?
The p-value indicates how likely your result is to hold up in other studies, rather than being a fluke of your sample. Most fields treat anything below p < 0.05 as “significant.” Effect size is a separate figure covered on the same page: it tells you how big the difference actually is, which matters because a result can be statistically significant without being practically meaningful.
Does it cover ANOVA or regression?
Briefly. ANOVA compares a numeric variable across multiple groups (the sheet’s example is math scores across three schools), essentially the t-test extended past two groups. Multiple regression predicts one variable from several others, like predicting a house’s price from its bedrooms, bathrooms and floor space. Both get a paragraph rather than a full table entry, so treat them as pointers to look up further rather than complete guides.
Can I print it?
Yes. It’s formatted for A4, so it prints cleanly as a physical reference, or you can just keep it open in a browser tab while you write.
Can Grad Coach help me with my statistical analysis?
Yes. If you need more than a reference sheet, actual help choosing a test, running it or writing up the results, that’s what our coaches do. Get in touch to discuss our private coaching services.
Get your copy, now.
Your cheat sheet is ready
It opens in a new tab, so this page stays right where it is.
Open your cheat sheet